Dashboard
Instructions
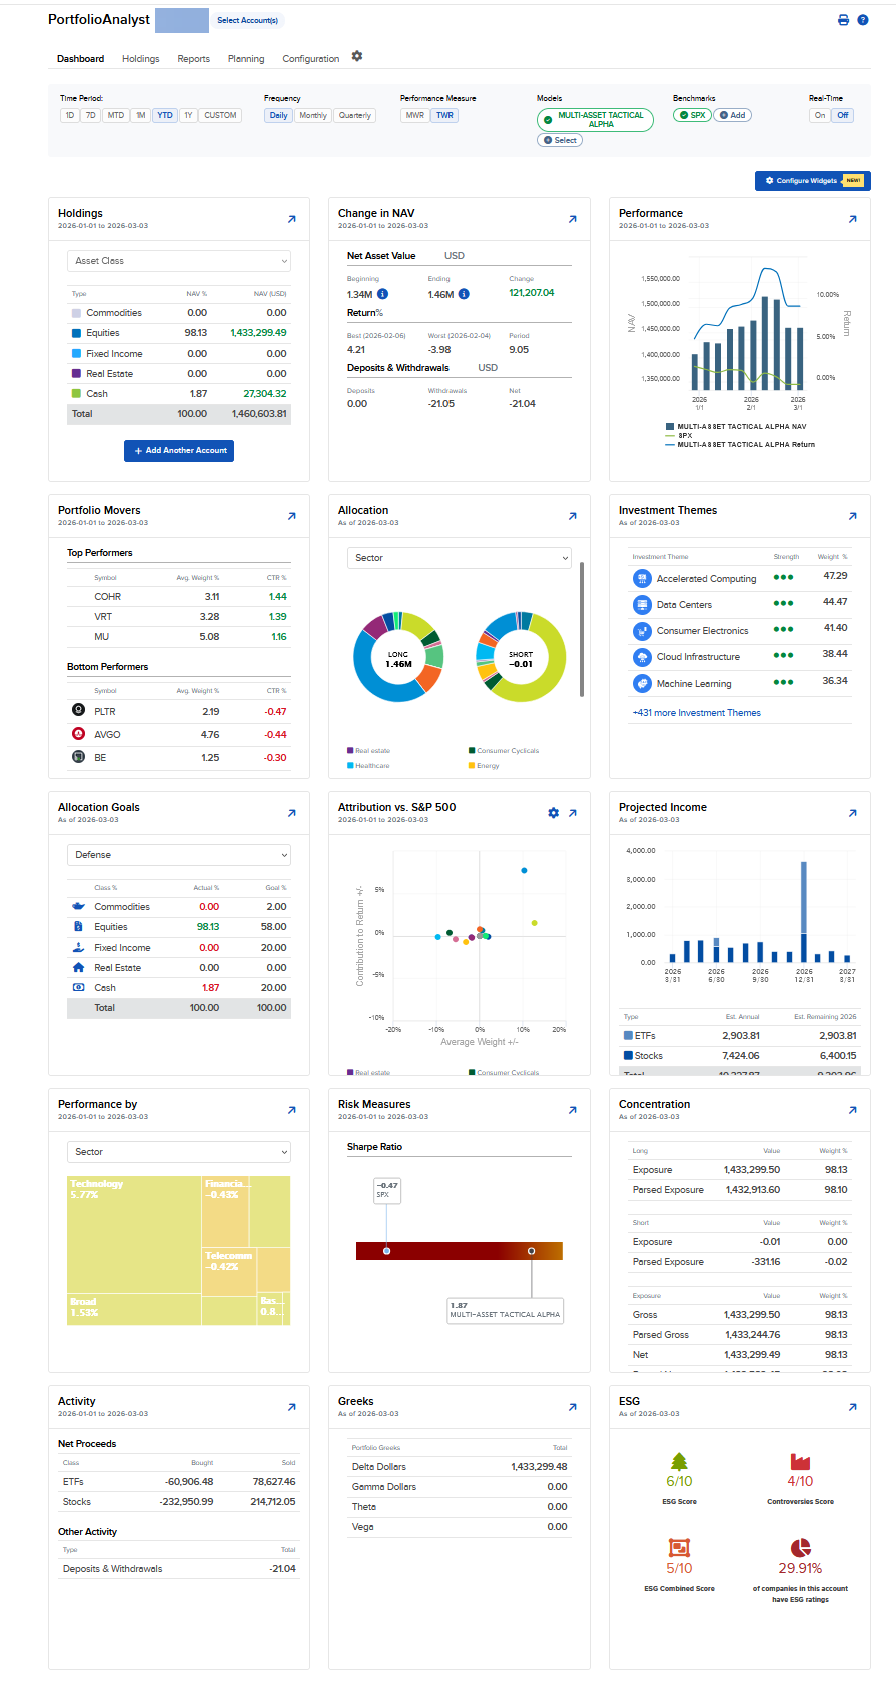
The Dashboard is the customizable home page of PortfolioAnalyst. It consists of widgets you can add, remove and reposition, presented in a consolidated layout across a specified time frame. Available widgets include Key Statistics, Portfolio Movers, Projected Income, ESG, etc.
To navigate to this tool, follow the steps below.
-
Select Performance & Reports > PortfolioAnalyst > Navigate to the Dashboard tab.
Alternatively, click Menu in the top left corner > PortfolioAnalyst > Dashboard.
-
If you have multiple accounts or account partitions, or if you have a master account and you manage one or more client accounts, use the account selector to select the account(s) you want to view.
-
If models are enabled in PA, you can select them from the top of the page to include models in the anaylsis
-
Investment Themes - View portfolio investment themes exposure and the companies within each theme.
-
Holdings - Value and performance of portfolio holdings, also summarized by asset class, account and account type. Drill down to activities for individual holdings.
-
Change in NAV - Portfolio net asset value (NAV) and return, along with deposits and withdrawals. Period, best and worst returns are included, as well as the distribution of returns.
-
Performance - Cumulative and time period returns by date, broken out by long and short, or optionally compared to up to three benchmarks.
-
Portfolio Movers - Performance of individual portfolio holdings, also summarized by financial instrument.
-
Allocation - Portfolio value and weight broken out by long and short and summarized by asset class, sector, financial instrument, region and country. Drill down to activities for individual holdings.
-
ESG - Environmental, Social and Governance (ESG) portfolio ratings. Includes overall portfolio scores, controversies distribution, scores for largest holdings, and top and bottom ESG performers.
-
Allocation Goals - Current vs. target asset and sub-asset class allocations for seamless portfolio rebalancing.
-
Attribution vs. Benchmark - Portfolio sector allocation and securities selection effect on performance compared to a benchmark.
-
Performance by - Portfolio performance by sector for the time period selected.
-
Risk Measures - Portfolio risk by a variety of measures, including Max Drawdown, Sortino Ratio, Sharpe Ratio, Calmar Ratio, Alpha, Beta, Positive Periods, Negative Periods, and more.
-
Concentration - Portfolio exposure by value and weight broken out by long and short, both with and without funds expanded (parsed) into fund holdings. Also summarized by asset class, sector, financial instrument, region and country.
-
Activity - Incorporates information from the PortfolioAnalyst downloadable report sections: Trade Summary, Deposits & Withdrawals, Interest, Fees, Dividends, and Corporate Actions.
-
Projected Income - Estimated income for the year ahead from dividends and interest based on portfolio holdings as of the previous business day.
-
Fixed Income - Metrics for bonds, treasury bills and notes. Includes average maturity, duration and coupon rate, breakdown by type, credit quality, maturity level, and projected interest payments by month.
-
Value at Risk - Portfolio value at risk calculated using historical and variance methods.
-
Greeks - Measure option price sensitivities with the Greeks: Delta, Gamma, Theta, and Vega
-
Interest Rate Sensitivity - Estimate how sensitive a portfolios fixed income positions are to changes in the interest rate environment.
-
What's New - Recent additions, enhancements, and changes to PortfolioAnalyst. Drill down for an in-depth description of each addition, enhancements or change.
View the data in 7 days (7D), month-to-date (MTD), monthly (1M), year-to-date (YTD), yearly (1Y), or choose a custom date range.

Select the frequency period you want the PortfolioAnalyst homepage to cover. Select between daily, monthly, or quarterly.

Quickly toggle between Time-Weighted Return (TWR) or Money-Weighted Return (MWR), view or hide the Benchmark chart and table of accounts.
-
View Time-Weighted Return (TWR) - TWR measures the percent return produced over time independent of contributions or withdrawals. TWR eliminates the impact of the timing of inflows and outflows and isolates the portion of a portfolio's return that is attributable solely to the account's actions.
-
View Money Weighted Return (MWR) - MWR is used to measure performance during the specified report period. MWR is influenced by the time of decisions to contribute or to withdraw funds, as well as the decisions made by the portfolio manager of the fund.
Add Benchmarks by clicking "+Add"
and selecting up to 3 from the list of benchmarks available. Search for a specific Benchmark or click the drop down to view 10, 25, 50, 100 or All Rows.
Once you have made your selection, click "Save" to add the data to your account.
