Price Oscillator
Shows the difference between two moving averages, in points. Unlike MACD which always uses the 12- and 26-day moving averages, Price Oscillator can use any two user-specified values.
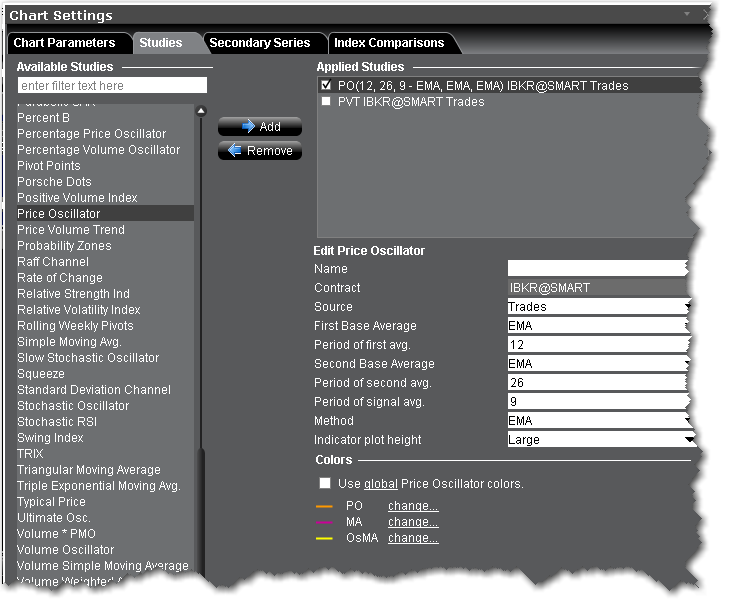
To apply a Price Oscillator Trend Indicator
- From within a chart, from the Edit menu select Studies.
- Choose Price Oscillator and click Add to add the study to the Applied Studies group.
- Complete parameters as necessary.
Once the study is defined, you can elect to uncheck/check to remove and add the study to your chart.