Apply an Average True Range Indicator
The Average True Range indicator is used to determine the volatility of the market. The idea is to replace the high-low interval for the given period, as the high-low does not take into consideration gaps and limit moves. You set the period when you create the study.
The True Range is the largest of:
- difference between the current maximum and minimum (high - low)
- difference between the previous closing price and the current maximum
- difference between the previous closing price and the current minimum
The Average True Range is a simple moving average of the true range values.
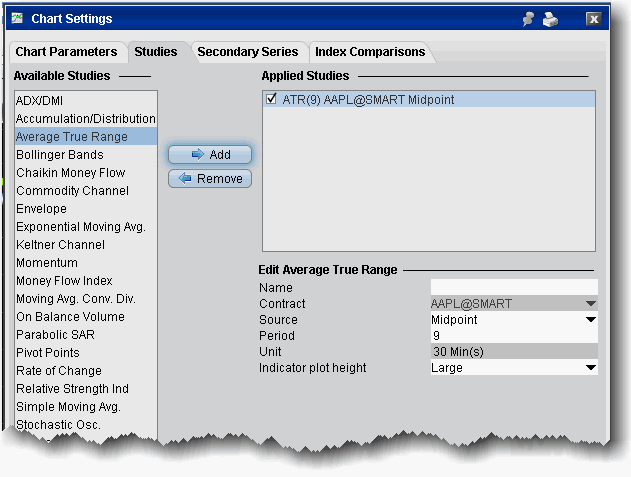
To apply an Average True Range
- From within a chart, from the Edit menu select Studies.
- Choose Average True Range and Add the study.
- Complete parameters as necessary.