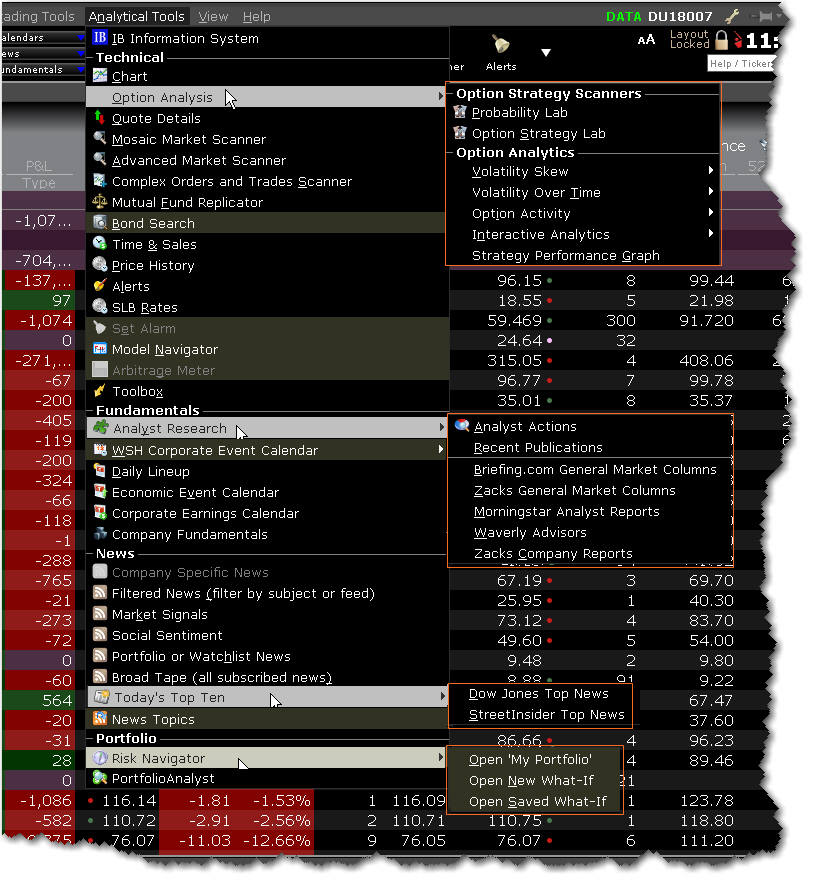
Classic TWS Analytical Tools Menu
| Menu Command | Description |
|---|---|
| Information System | Opens the Mosaic tab workspace tab. |
|
Chart |
Opens the new chart window with the Contract Description populated based on the contract you selected in the trading window. |
| Option Analysis |
Displays a list of analytical option tools:
|
|
Opens a floating window that shows quote, high/low and volume data for a single underlying. |
|
| Mosaic Market Scanner | Scan the markets for the top-performing products based on user-selected criteria. |
|
Scan the markets for the top-performing products based on user-selected criteria. |
|
| Complex Orders and Trades Scanner | Returns all complex strategies on a specific underlying that has a native bid/ask quote or that has traded today. To find the strategy that has traded the most today, sort the results by Volume (click on the Volume column to sort). |
| Mutual Fund Replicator | The Mutual Fund Replicator finds an ETF(s) whose performance parallels that of a user-specified mutual fund. |
| Bond Search | Opens the Bond Search query in a browser window. |
|
Displays Time & Sales for the selected instrument . |
|
| Price History | Shows history for the Open, High, Low, Close and Volume history on the selected underlying. |
|
Alerts |
Set time, price or margin-based alerts. |
| SLB Rates | Shows current Borrow/Loan Fee and historical rates on the selected underlying. |
|
Define an alarm for the selected underlying. |
|
|
Edit pricing assumptions to calculate model prices. |
|
|
The Arbitrage Meter illustrates the extent of the premium (or discount) of the lead month futures price above (or below) its fair future value with respect to the index price. |
|
| Toolbox | Opens the Toolbox window which allows one-click access to useful analytical tools including : Market Depth, Time & Sales, Price History, SLB Rates, Option Chain, Fundamentals, Alerts, News, Charts and Analyst Research. |
| Analyst Research | Subscription-based research including: Briefing.com, Zacks, Morningstar and Waverly Advisors. |
| WSH Corporate Event Calendar | Available to subscribers to Wall Street Horizon. View events for the selected instrument . |
| Daily Lineup | Designed to be viewed first thing in the morning, the Daily Lineup provides a birds-eye view of upcoming market events. |
| Economic Event Calendar | Lists major economic events for specific date/region. Requires research subscription to Thomson-Reuters. |
| Corporate Earnings Calendar | Shows corporate earnings data and upcoming events for contracts in your portfolio, your Watchlists and/or your Quote Monitors. Requires research subscription to Thomson-Reuters. |
|
Displays business and financial summary data, charts, scanners and more for the selected instrument . |
|
|
Company Specific News |
Displays industry-related news and commentary for the selected underlying. |
|
Filtered News |
Filter news by subject or newsfeed. |
|
Market Signals |
Our data servers continuously scan the markets for irregular price and volume actions and transmit these notifications directly to your trading interface in the form of Market Signal alerts. Available market signals include price spikes, irregular volume spikes, new 52 week highs/lows, put/call ratio spikes, trading halts and more. |
| Social Sentiment | Subscription-based news. |
| Portfolio or Watchlist News | Show news for all companies in your portfolio and/or all tickers in your Quote Monitors and Watchlists and/or a custom list of tickers with news on competitors of custom tickers. |
| Broad Tape | Shows all subscribed news. |
| Today's Top Ten | Tops news headlines by StreetInsider, or Dow Jones (based on subscription). |
|
Opens the New Topic Chooser that allows you to include industry-specific news in the ticker lines. |
|
|
Opens the Portfolio Analyst reporting tool in Account Management. |