TWS 2020 Production Release Notes
Build 981: October 2020
Interactive Brokers is dedicated to helping you make better investment decisions. In 2018 we introduced Refinitiv Environmental, Social and Corporate Governance (ESG) metrics to provide transparency into company policy and its non-financial effects. Recently we enhanced ESG to allow you to be notified when companies engage in activities counter to your values.
Now we've expanded our responsible investing offerings even more with the interactive Impact Dashboard, which incorporates a new data source from TruValue Labs that scores companies against the Sustainability Account Standards Board (SASB) criteria.
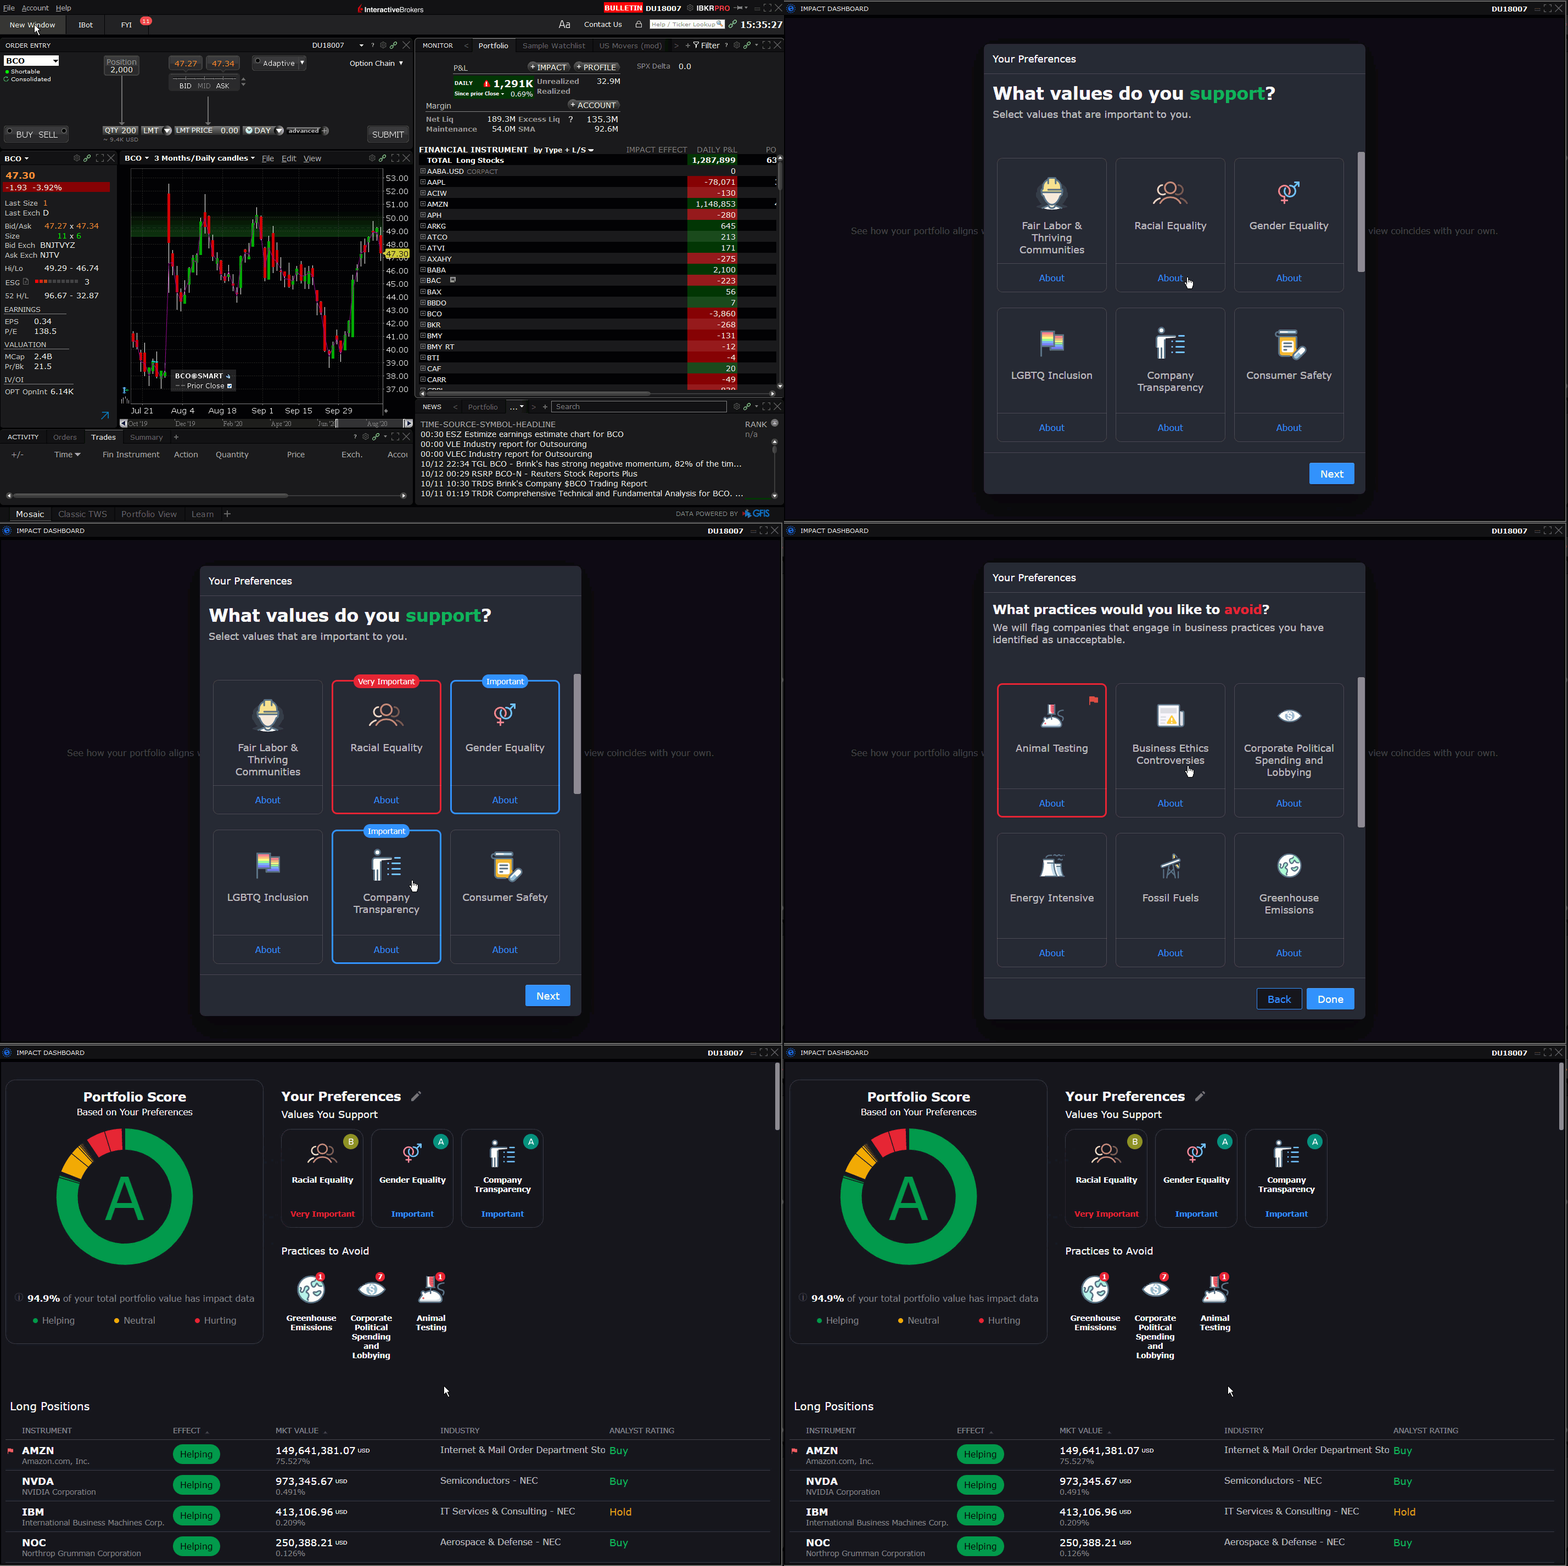
Use the Impact Dashboard to evaluate and potentially adjust your portfolio to invest in companies whose responsible world view coincides with your own. Choose the impact values and principles that are important to you, like Racial Equality and No Animal Testing. Then let the Impact Dashboard analyze and grade your portfolio based on how your positions align with your principles. The dashboard even shows how each individual investment is helping or hurting your overall Portfolio Impact Score .By viewing companies through an "impact lens" of your own design, you can clearly see whether their socially-responsible goals and principles line up with yours.
To open the Impact Dashboard:
- In Mosaic: Use the Impact button in the Portfolio or from the New Window drop-down select Impact Dashboard.
- In Classic: Use the Impact icon in the menu bar.
To use the Impact Dashboard
Follow the prompts to set up your dashboard.
- Click to select the values that are important to you, and click a value again to tag it as "Very Important." Once you have made your selections, click Next to tag the practices you want to avoid. Read more about any value by clicking About.
Note: To make your Impact Score more meaningful, be sure to limit your selections to the values that are most important to you. They are used in the calculation of your Portfolio Impact Score, and the more values you select, the less impact each value has on your score.
- Click to select all of the Environmental, Social and Governance (ESG) practices to which you're opposed.
Note: These practices are not used in the Portfolio Impact Score calculation. Instead, we will "red flag" companies that engage in these practices so that you can avoid them if you want.
Understanding your Score
Once your selections are made we'll use this information along with the available impact data to analyze your portfolio and provide you with your Portfolio Impact Score.
- Your Portfolio Impact Score is presented in the center of the chart. Directly under the chart we tell what percentage of your portfolio provides impact data to help make the grade more meaningful.
- Hold your mouse over a slice of the chart to see the weight each slice holds within the Aligns with, Conflicts with and Neutral segments.
- To the right of the doughnut chart see the values and practices you selected as being important:
- Values show a letter grade in the top right corner. This grade identifies how well or how poorly your portfolio performs in this specific area. Select a graded value to see more details that show how your investments contribute to the value grade.
- Flagged practices show a red number in the upper right corner. This indicates how many companies in your portfolio engage in specific practice. Select a flagged practice to see which companies in your portfolio engage in that practice.
- Below the chart see the list of all of your positions with the Impact Effect, Industry, Analyst Rating and more. Click an instrument to see how going long or selling short would affect your Portfolio Impact Score.
- For those position that either conflict with or are neutral toward your values, click to see a list of comparable, alternative instruments that are more in line with your principles. Elect to trade out of the conflicting/neutral asset and create a position in an alternative instrument.
Edit your preferences at any time by clicking the pencil icon next to the Your Preferences title.
Now you can see current and trending market sentiment scores for companies in your Watchlist, Portfolio and throughout TWS with social sentiment data from Social Market Analytics Inc. (SMA). Data is derived from the content and volume of unique Tweets, which have been triple-filtered for relevance and credibility from the daily Twitter stream of over 500 million Tweets. Social Sentiment scanners coming soon.
Current data coverage includes the entire US equity universe, over 3000 global ETFs and the LSE FTSE 1000, with content updating every 1 minute. FX and Commodity futures and FX Spot coverage coming soon.
We provide the following data points that you can view in the Social Sentiment widget in the Fundamentals Explorer and in the Social Sentiment columns that you can display in your Watchlists, Scanners, Portfolio and other tools:
- Social Sentiment Score: The normalized, time-weighted summation of sentiment of Tweets from credible accounts across a 24-hour rolling window, at the time of observation. Tweets arriving closer to the observation time carry more weight than those that arrived farther from the observation window. For example, at 09:10 AM, it is the summation of sentiment of tweets received between 09:10 AM the previous day and 09:10 AM today weighted such that the tweets closer to 9:10 AM today are weighted higher.
- Social Sentiment Score Change: From the prior day's average.
- Tweet Volume Score: Normalized value of Indicative Tweet volume used to compute the social sentiment score, which is the number of unique tweets arriving in a 24-hour interval from certified Social Market Analytics accounts.
- Tweet Volume Score Change: From the prior day's average.
- Social Sentiment Score Delta (15-Minute Sentiment Change): Change in Social Sentiment Score over a 15 minute look-back period.
- Tweet Source Diversity: Measure of the Tweet source diversity contributing to a sentiment estimate. At the time of observation, this value is calculated as: Number of unique accounts / Tweet Volume Score.
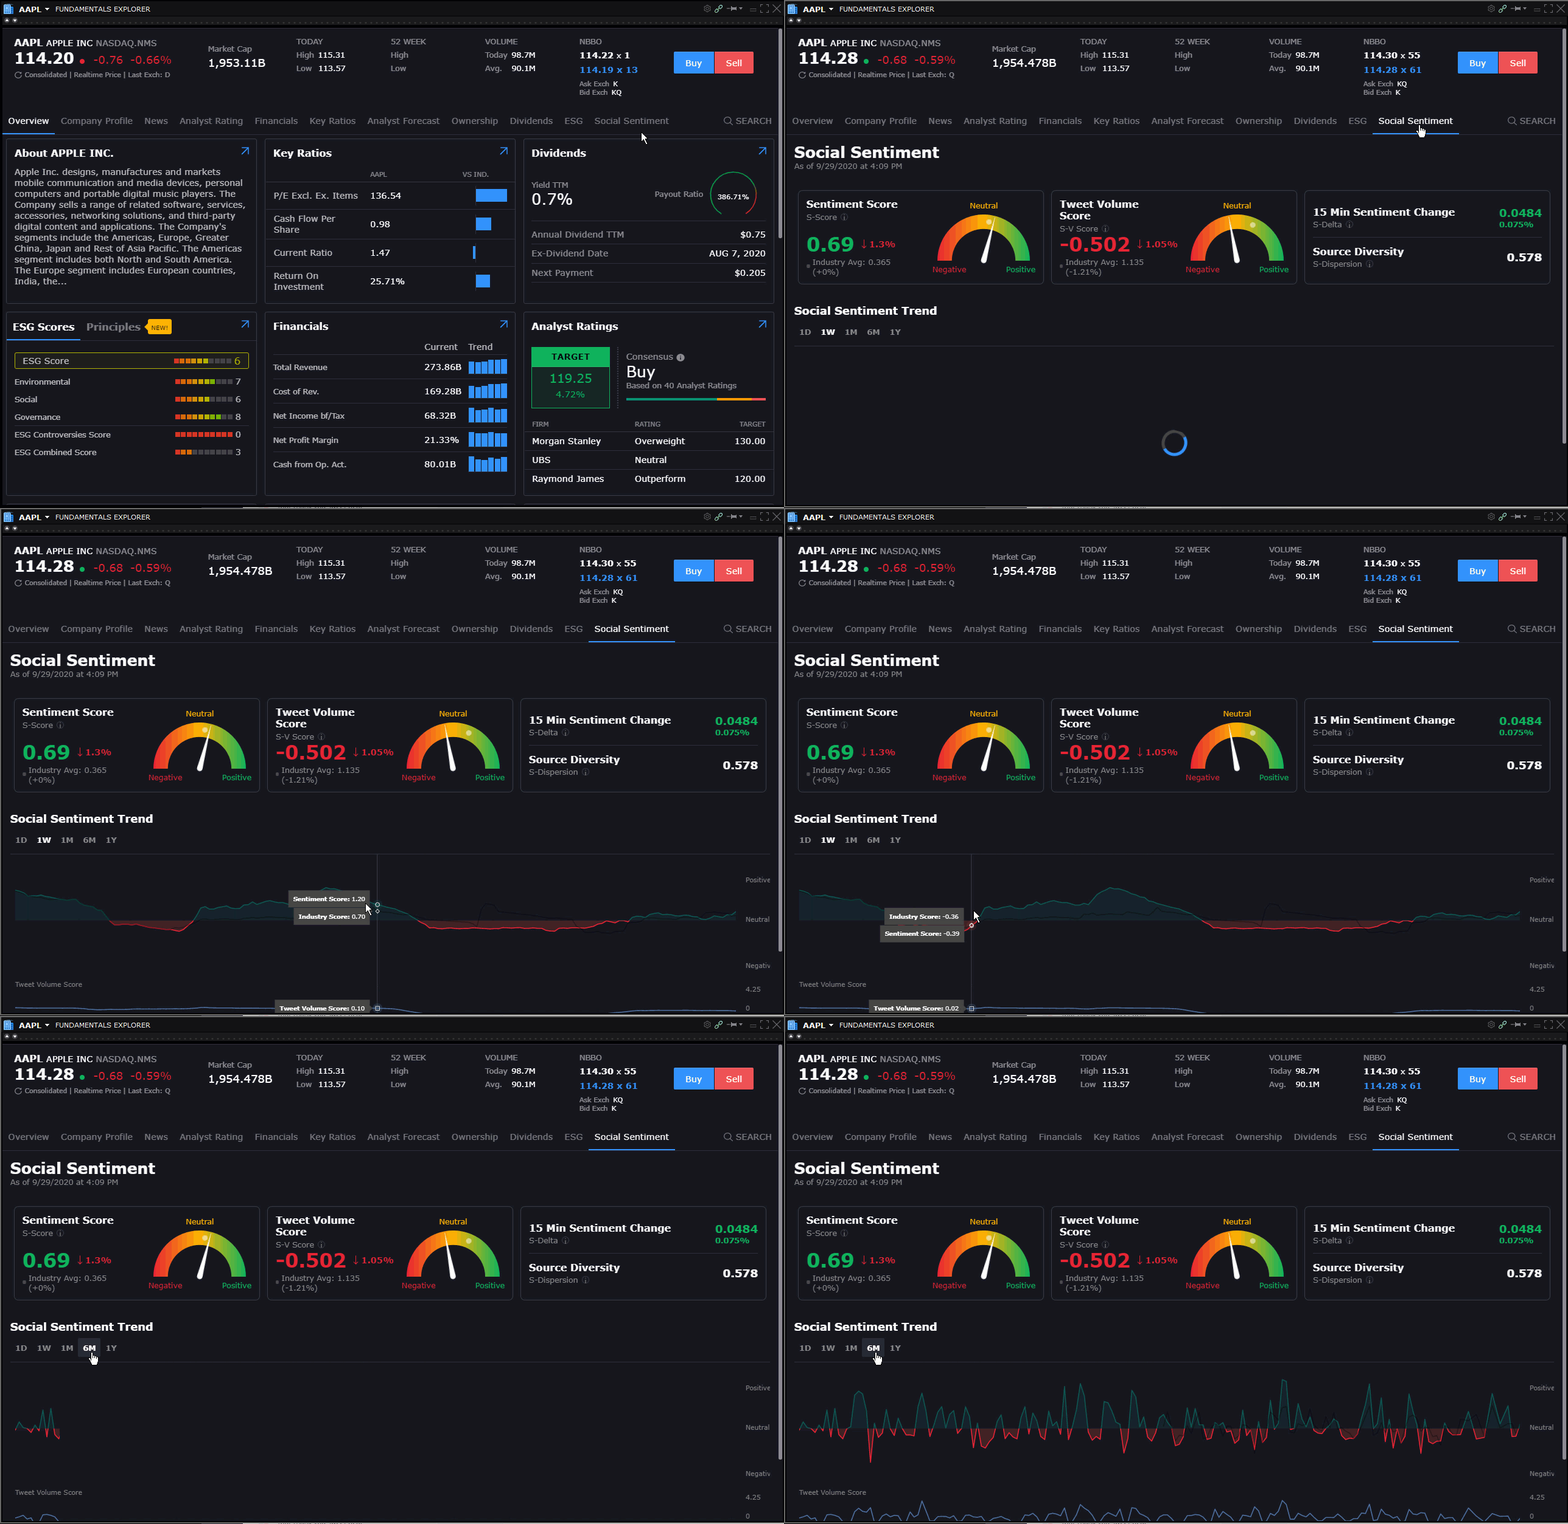
- Social Sentiment Trend chart: See how sentiment is trending over different time periods (1 day, 1 week, 1 month, 6 months and 1 year) with Tweet Volume sub-graph in the bottom panel of the chart.
Social Sentiment Widget in Fundamentals Explorer
Open Fundamentals Explorer from the Mosaic New Window drop-down. In the Fundamentals Explorer, click the Social Sentiment tab to see a graphical representation of data points listed above.
Social Sentiment Columns
Add Social Sentiment columns to your Watchlist and other tools to see the current market sentiment for specific companies. Score and volume values range from -4.25 to 4.25. A score of 3 or higher indicates extremely positive sentiment/high volume. A score -3 or lower indicates extremely negative sentiment/low volume. Column values are color-coded for at-a-glance assessment:

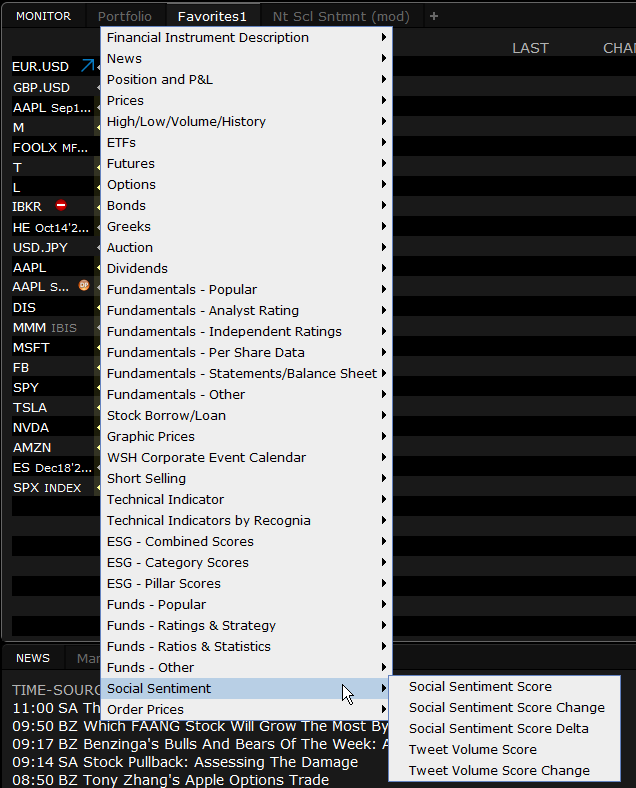
To add columns to a window, hold your mouse over an existing column name until the Insert Column command appears. Click Insert Column and scroll to the Social Sentiment column group. Click a title to add the column to your window. Hold your mouse over a title in the group to see the column definition.
This release includes:
- Vulnerability patches to TWS: Due to a global vulnerability in popular infrastructure software known as "Log4j," we recently updated libraries for all versions of our TWS software. If you use the standalone "Offline" version of TWS, you must manually upload the most recent version to get the patch. If you used the Login menu to install an updating version of TWS to your desktop, you will receive the patched version when you log in.
Build 980: August 2020
The more you know about a company, the better investment decisions you can make. We've expanded our Environmental, Social, and Governance (ESG) ratings functionality to include the ability to identify companies engaging in controversial business practices that don't align with your values. Use the ESG tab in Fundamentals Explorer to tag such activities that concern you, like:
- Animal testing: Companies selling personal and household products and services that are tested on animals.
- Business ethics controversies: Companies associated with the highest number of ethical, political and corruption-related controversies, as reported in the media.
- Corporate political spending and lobbying: Companies that donate the most in support of political parties/candidates and spend the most on lobbying, relative to size.
- Energy intensive: Companies with the highest total energy usage.
- Fossil fuels: Companies that operate in the coal industry and /or are among the largest producers of oil.
- Greenhouse emissions: Companies with the highest reported direct and indirect CO2 emissions.
- Hazardous waste: Companies responsible for creating the largest volume of hazardous waste.
- High-water usage: Companies with the highest levels of water withdrawals.
- Tobacco, alcohol and gambling: Companies that derive revenue from the sale of tobacco and alcohol or from gambling activities.
- Weapons and gun manufacturers: Companies that derive revenue from the sale of military equipment and weapons.
When you look at a company in Fundamentals Explorer, look at the Principles section of the ESG Scores/Principles widget on the Overview page to see how a company's practices align with the principles you hold.
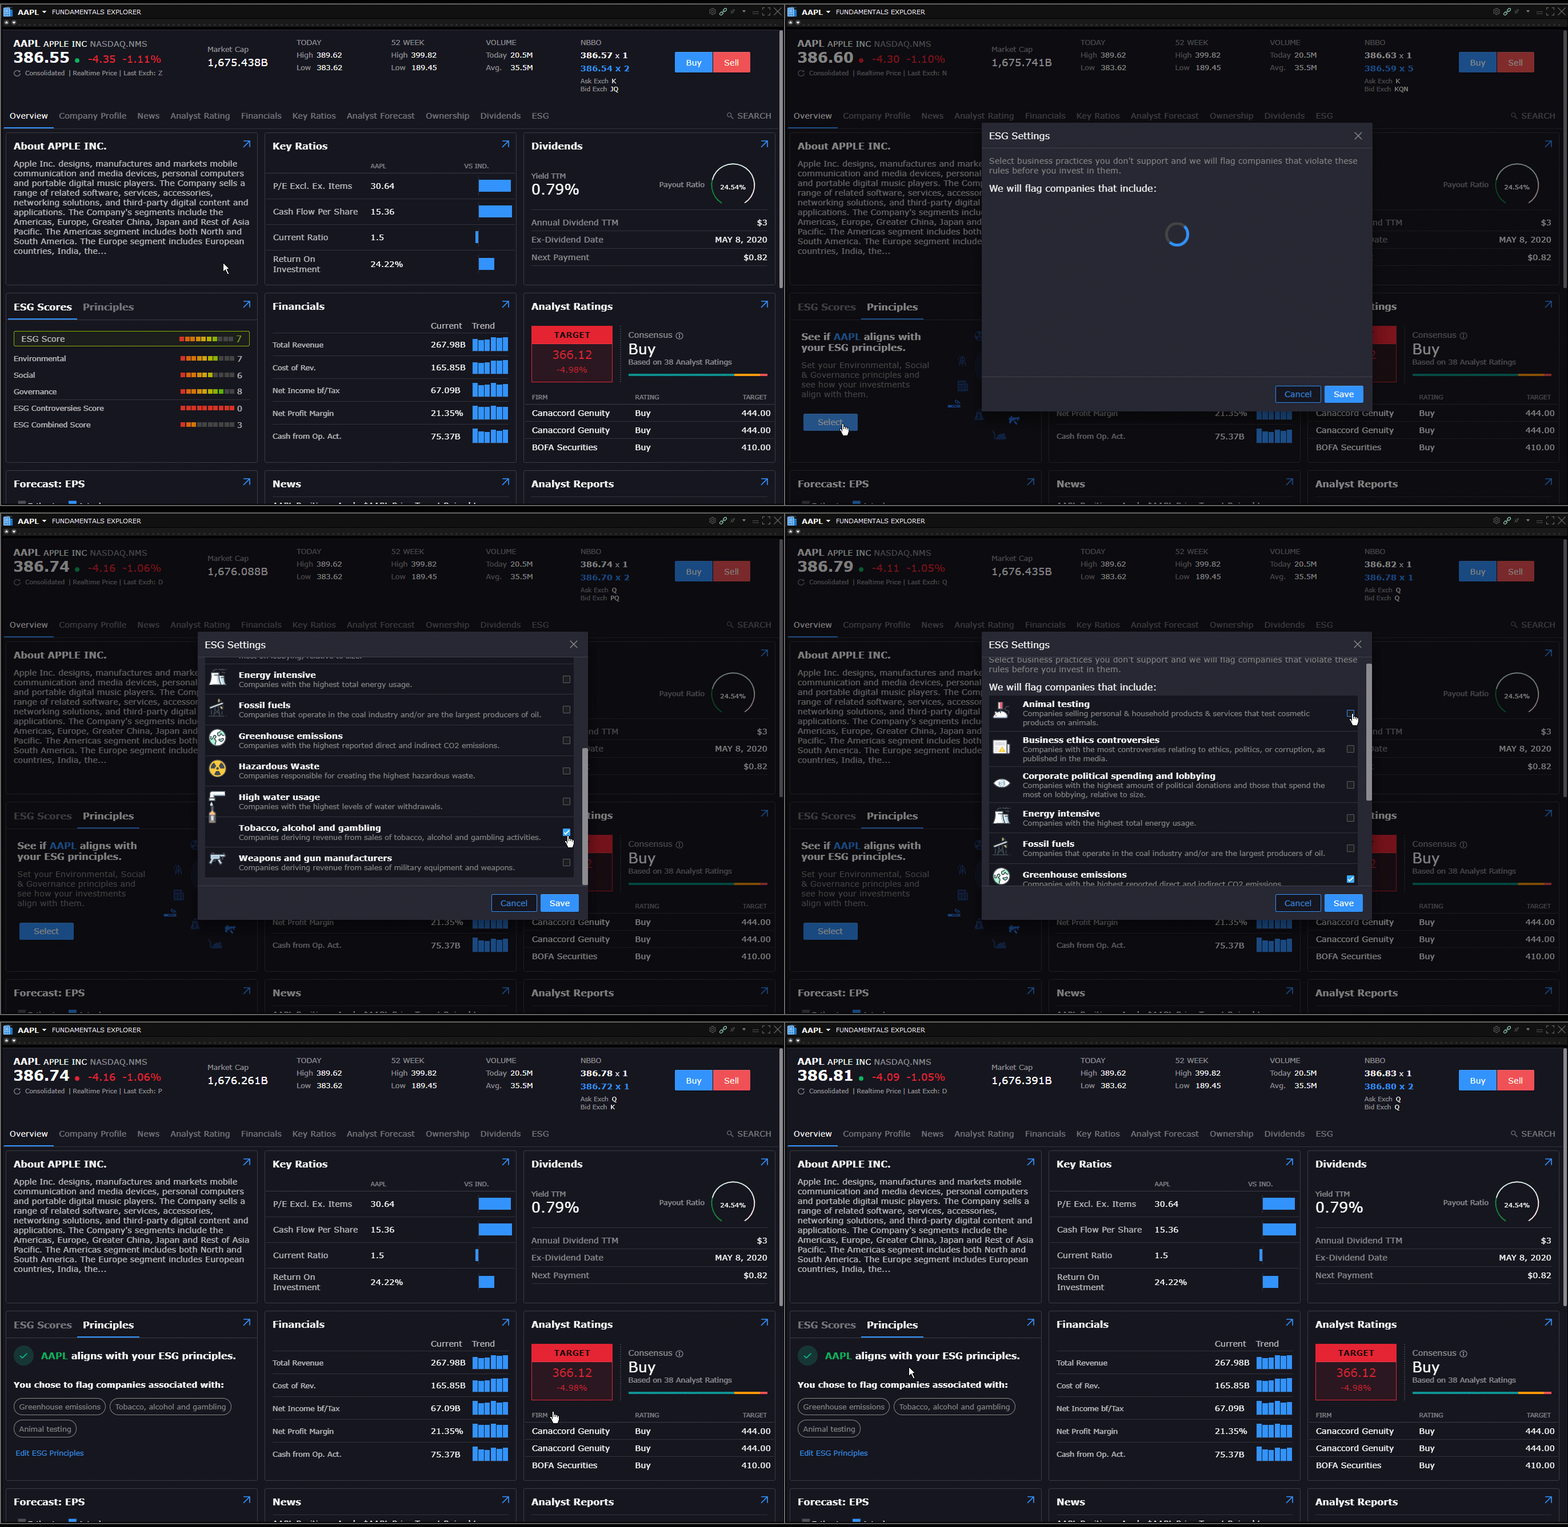
To define your principles, open the Fundamentals Explorer from the Mosaic New Window drop-down. Select the ESG tab and use the Principles tile to tag controversial business practices that concern you.
Currently available in Desktop TWS. Available soon in Client Portal and IBKR Mobile. Check back often as we continue to enhance our ESG offerings.
Now you can watch video tutorials, browse some of our most-requested FAQs, and keep abreast of the latest News@IBKR all without leaving TWS. Our new Learn tab showcases all of the latest and most useful features that TWS and IBKR have to offer. Check back often to see what's new and to find out more about all of the tools and products in TWS.
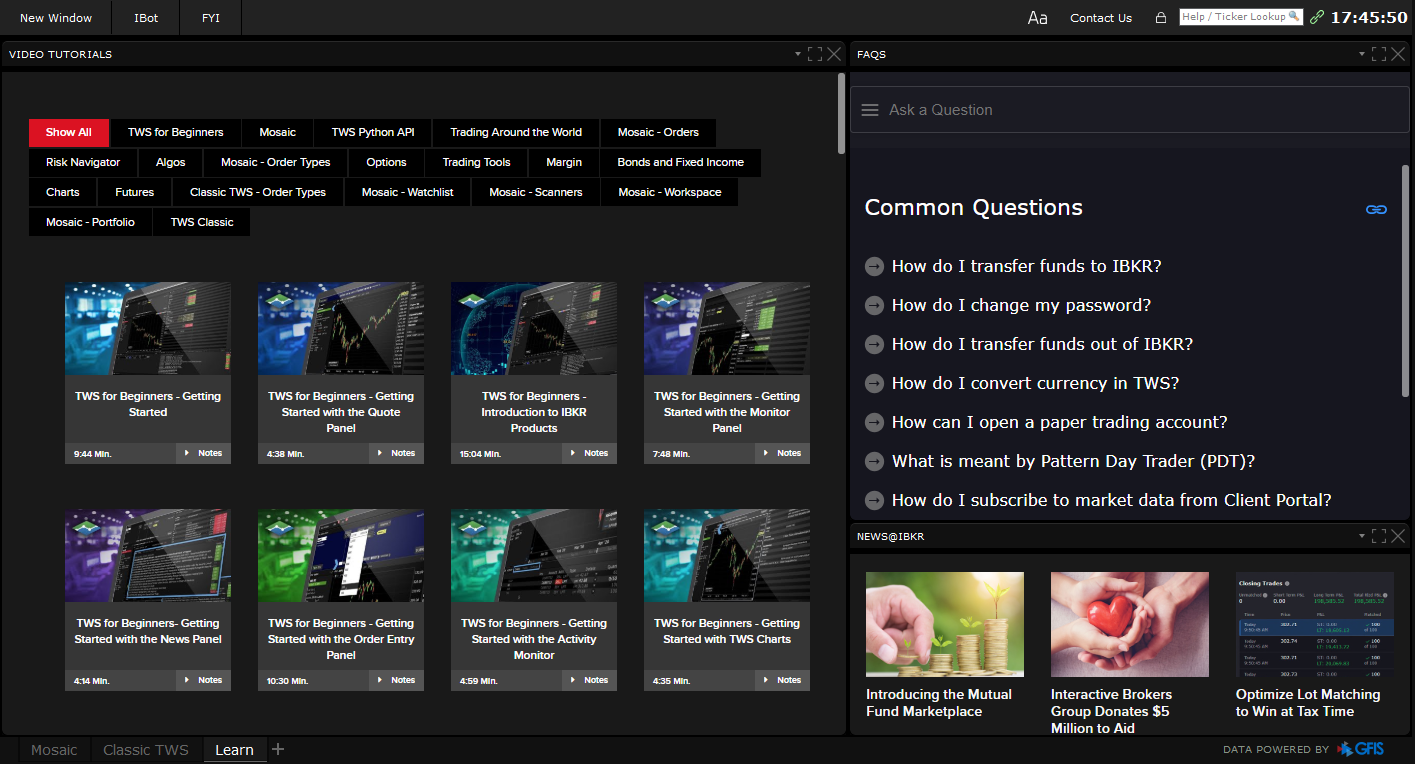
Find the Learn tab in the Layout tabset along the bottom of TWS.
With the new Algorithm Favorites preset in Global Configuration, you can now define IB Algo preset values that will populate the order parameters when you select that algo as the order type.
To set IB Algo Favorites presets, open Global Configuration (from the Mosaic File or from the Classic Edit menu) and scroll down to Presets in the left panel. Select a supported financial instrument, for example Stocks, and in the right panel scroll down to Algorithm Favorites. Select an IB Algo and define preset values. The values you define will populate the algo by default when you choose it as your order type, but you can modify any value on any order, and change preset values at any time.
- The Portfolio tab on OptionTrader, BookTrader, SpreadTrader, and other tools has been updated to use the stand-alone Portfolio window layout, including all sorting and grouping features.
- Multi-account users can now use Cash Quantity to calculate order shares instead of share amount for share allocation orders.
Build 979: June 2020
Now you can change your trades' cost basis directly within TWS using the built-in Tax Optimizer tool. You can try up to seven different automated matching methods across all lots, methods like Last In, First Out or Maximize Long Term Gain. You can apply a method to a single closing trade, or manually match a specific open lot to a specific closing trade. See potential profit and loss using your selected method(s), broken out by long-term and short-term gain or loss.
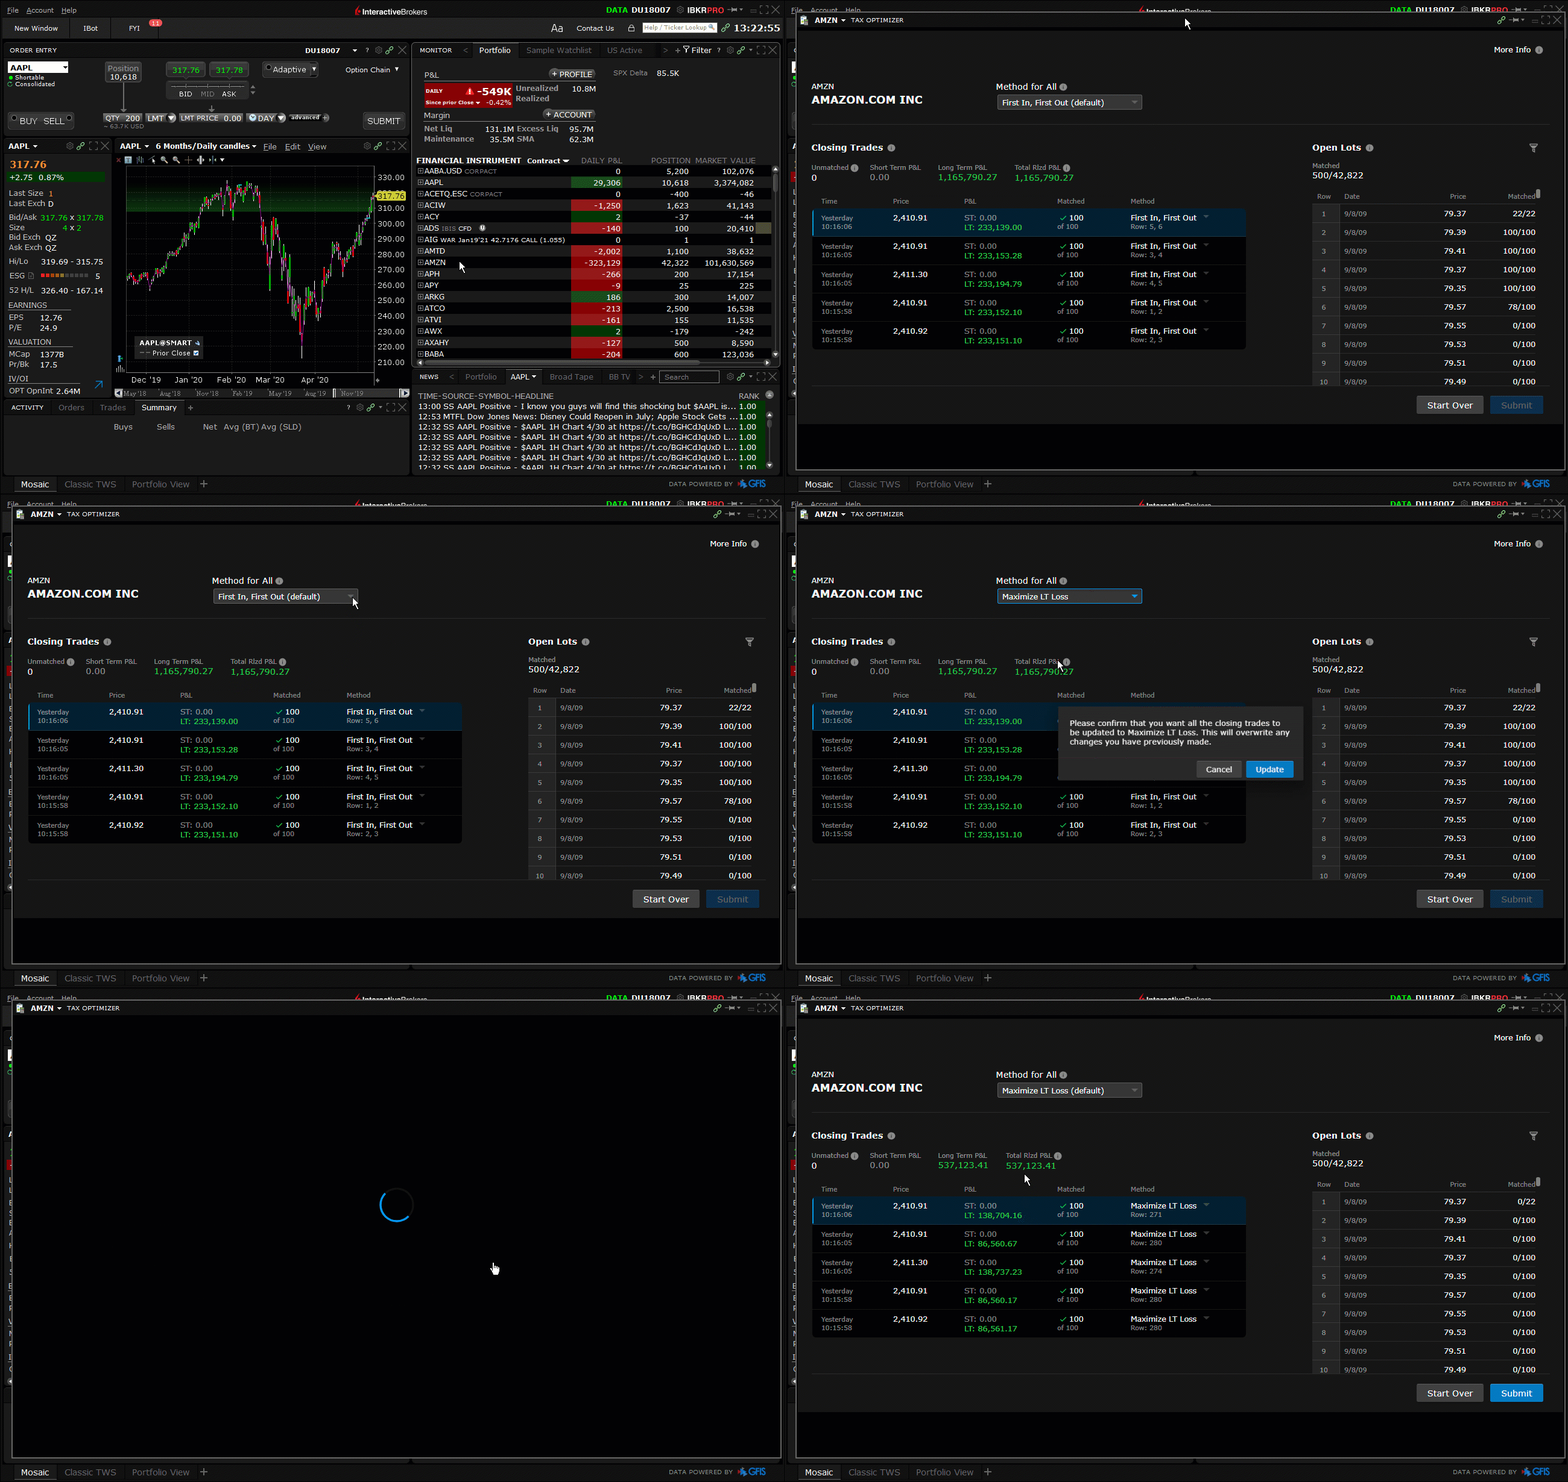
To use the Tax Optimizer, start from the Trade Log, your Portfolio, or a Watchlist. Right-click on any ticker and select Change Tax Lots. If this selection isn't visible, expand the context menu using the arrow at the bottom of the right-click list. If you have available lots to match, the Tax Optimizer window will populate. The Closing Trades sections displays all unsettled trades that are available for matching. Modify the tax lot matching method individually for each Closing Trade, or select a matching method from the pick-list in the top panel to apply to all closing trades. When you change the method, both your short and long-term P&L are recalculated. When done, click Submit to save. These changes will be reflected on your next account statement. You can make changes to a trade's matching method until it has settled.
Tax Optimizer is not available to Canadian or Interactive Advisors clients.
With the Fundamentals Explorer, now traders can access more company fundamentals data on stocks and mutual funds than ever before! Designed to help you better gauge the fundamental value of an asset, the explorer includes Company Profile, Financials, ESG Rating, Key Ratios, Competitors and more. We've added over 200 new company and ETF ratios including graphical trends to show how key financial ratios have trended in the past five years and comparisons to peers within the same Thomson Reuters Business Classifications. Expand on the ratio to view a bubble chart comparing the same ratio against four peers with the nearest market capitalization, and compare ratio trend values with a peer. Select a competitor to continue your fundamentals research. In addition to hundreds of fundamentals data values, we now provide a cross-link between company reported statement filings and analyst forecasts for key values, and have added graphical charts to help you quickly assess data trends and surprises to analyst's estimates.
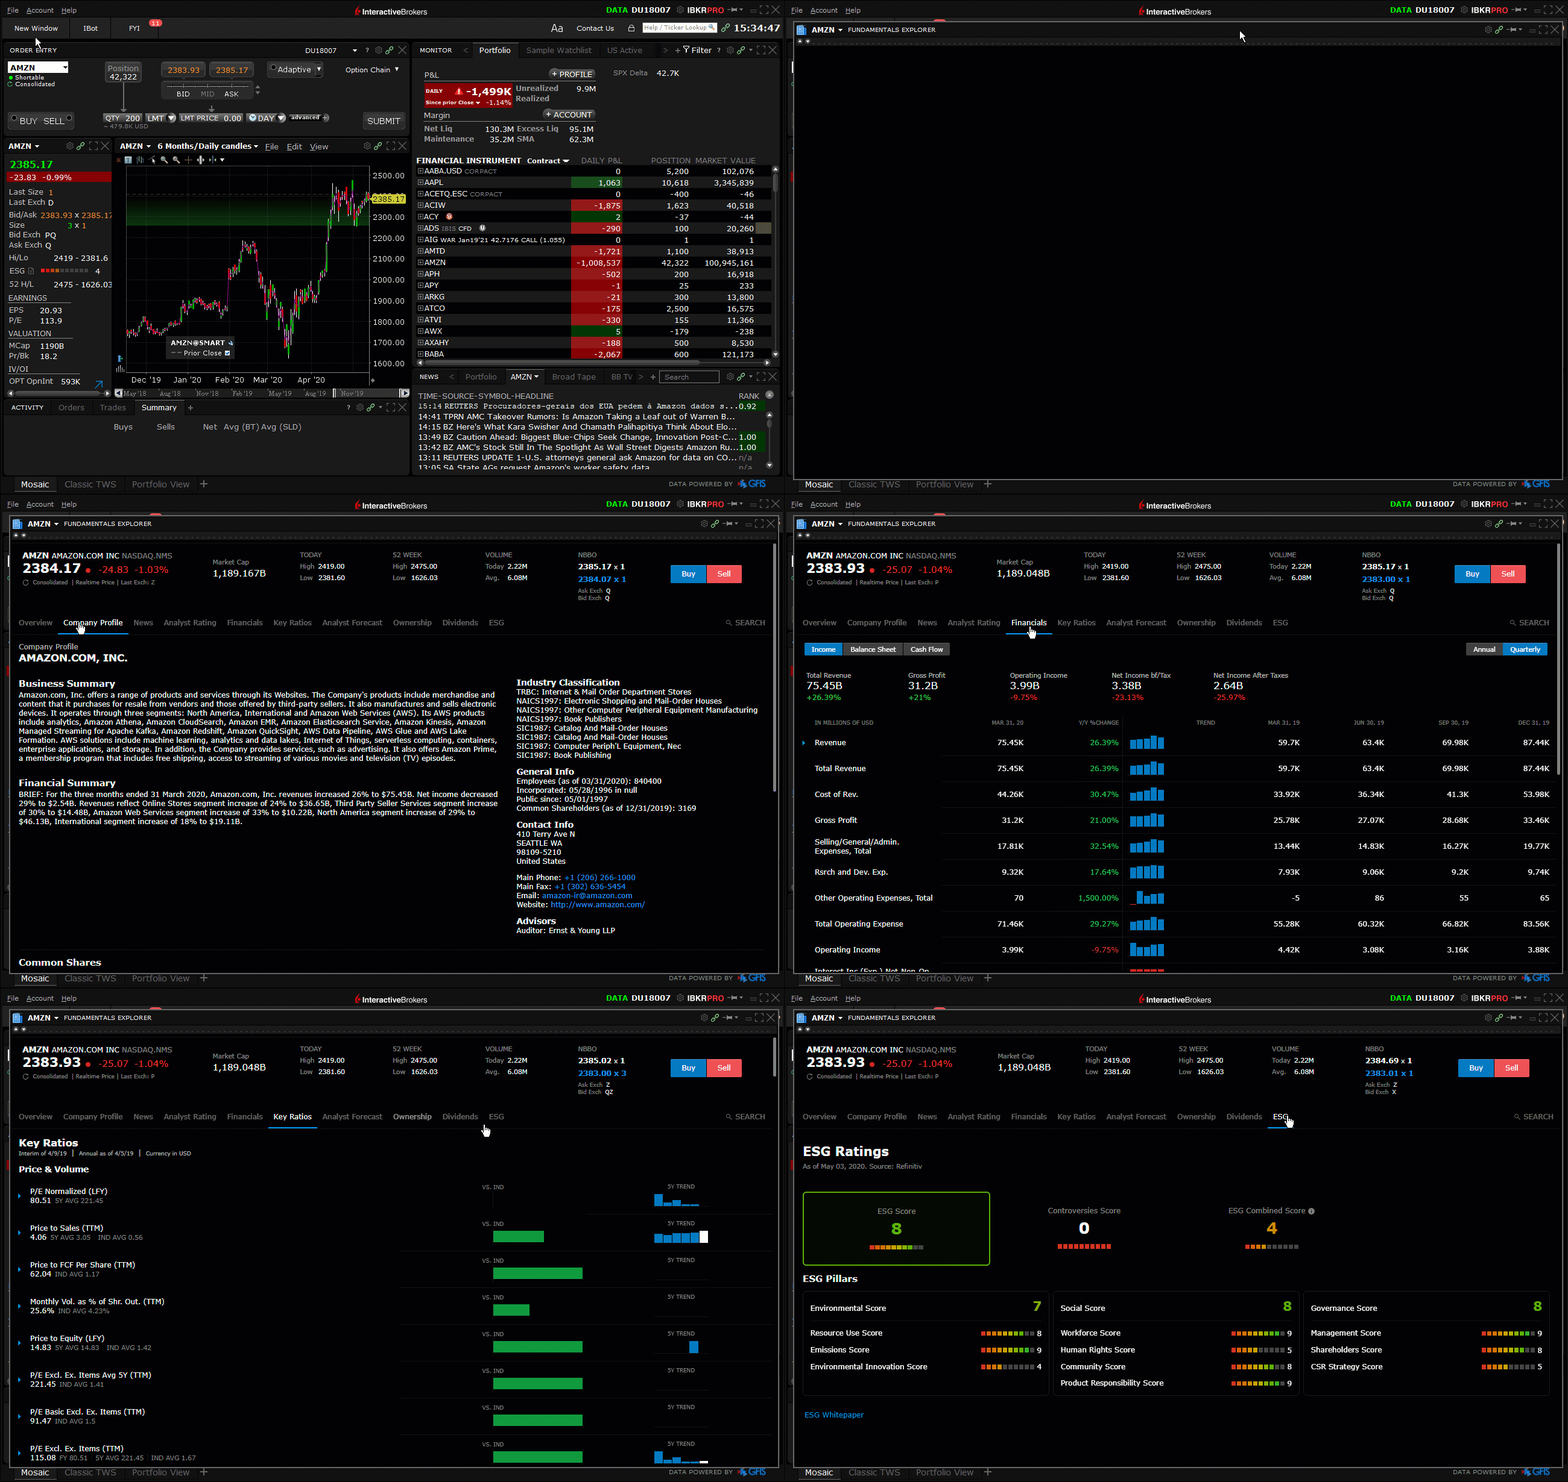
To access the Fundamentals Explorer in TWS, right-click a stock or fund symbol and select Analytical Tools and then Fundamentals Explorer. Use the tab set below the quote details to move between categories. Hold your mouse over graphical values to see more depth. The Fundamentals Explorer is free to all clients and trial users and is available across all of our trading platforms.
TipRanks ratings have been expanded to include non-US stocks, with added coverage for over 6,700 Canadian and European companies. TipRanks evaluates recommendations by financial analysts and bloggers, and then ranks their recommendations based on historical accuracy and performance.
To view TipRanks Ratings and Sentimental Analysis, select a symbol and open Fundamentals Explorer from the New Window drop-down. Open the Analyst Ratings tab and click TipRanks Ratings or TipRanks Sentiment.
TipRanks Ratings and Sentiments are available across all of our trading platforms, including Client Portal, IBKR Mobile for iOS and IBKR Mobile for Android.
Advisors now have access to our comprehensive Portfolio Builder tool. This all-in-one interface allows traders to:
- Construct sophisticated investment strategies, founded on research and rankings from top buy-side providers and global fundamentals data
- Thoroughly backtest these strategies based on up to eight years of historical performance
- Adjust as needed based on performance metrics
To open Portfolio Builder, use the Mosaic New Window dropdown and locate the tool in the Trade section.
To find out more about Portfolio Builder, see the Feature in Focus page.
To invest using Portfolio Builder, your account must be enabled for Model Portfolios. To do this, log into Client Portal and from the menu select Settings and then select Account Settings. In the Configuration panel on the right select the configuration gear icon for Model Portfolios to enable. Advisors who aren't enabled for Model Portfolios can use Portfolio Builder to build and backtest strategies, but will not be able to invest in models.
Want to buy just $500 worth of an expensive stock, or looking to diversify among more investments? Now you can - fractional share trading with the ability to enter order size in terms of dollar amounts (Cash Quantity) is now available. To use this feature you must first enable it by logging into Client Portal and selecting Settings and then Account Settings. Click the gear icon in the Trading Experience & Permissions section and expand the Stocks section. Check United States (Trade in Fractions) to enable.
How it works: When using a Cash Quantity order, you specify the dollar amount you want to buy instead of specifying the number of shares. Rather than buying five shares you elect to buy, for example, $500 worth of a stock. We purchase the equivalent number of shares for that value rounded down to the nearest whole share. If you enable your account to Trade in Fractions, we will buy a fraction of a share to use the full amount of cash you specified and get the greatest possible number of shares for your money. If you want to spend $500 but one share of the stock you want to buy is currently $1000, you would end up with 0.5 shares.
The ability to trade in fractions also makes it easy for you to diversify your portfolio; if you have $500 to spend you can purchase fractional amounts in multiple companies when you otherwise might only be able to purchase whole shares in two or three companies.
To use cash quantity for an order, click in the Quantity field to display the Size Wand, and toggle to USD (or relevant currency). Specify the cash amount you want to use. When the order fills, it will fill as close as possible to your specified amount, rounding down to the nearest whole share if you haven't enabled trading in fractions. See below for more details.
This feature is available to both IBKR Pro and IBKR Lite clients, and is supported for a subset of US stocks. Advisors must enable this feature for their master account before clients can enable and use the feature.
Now you can specify the cash amount you want to spend on a stock order using the Cash Quantity feature. When you specify a cash value for your order, that value in conjunction with the instrument price drives the number of shares purchased. If the price moves, the number of shares is adjusted to accommodate the entered cash value. Shares are rounded down to the nearest whole share. For even more precision, enable your account to Trade in Fractions. This eliminates the need to round down and uses the full amount of cash value.
To use Cash Quantity for a stock order, click in the Quantity field and toggle the size calculation method from Shares to USD (or the currency of the instrument). Enter or select a cash value and see the approximate share equivalent directly below. Shares are approximate until the order fills.
Because the price may move before the order fills, we apply a "Cash Quantity Estimate Factor" when calculating the order quantity. This factor, set to 25% by default, increases the calculated order quantity to try to achieve the desired monetary outcome in cases where the price drops (for a buy) or rises (for a sell) by allowing more units to be bought or sold. You can change the default "25%" in the Size section of the Stock preset in Global Configuration.
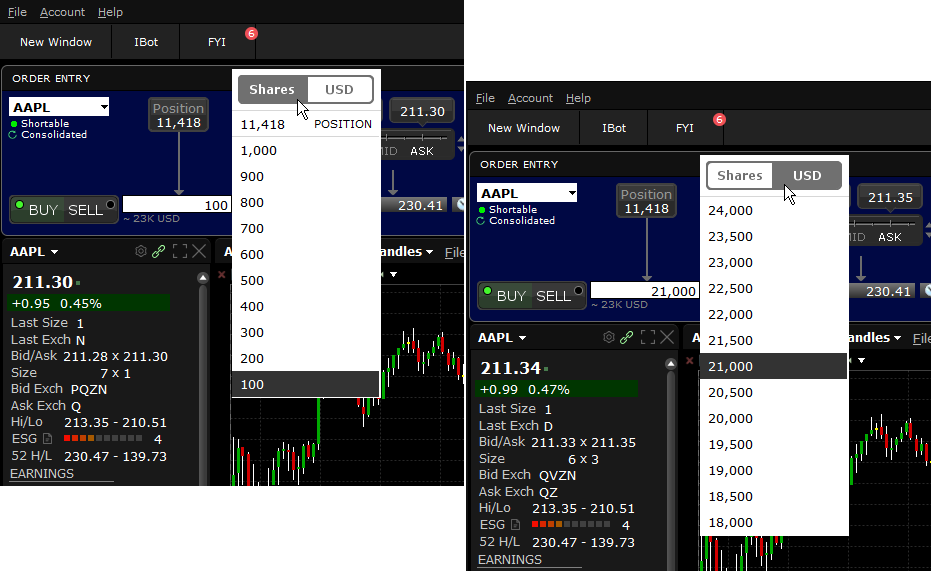
The Cash Quantity feature is available for stocks orders in all currencies, and is supported for almost all order types and IB Algos.
Sell orders are not currently supported for Cash Quantity stock orders.
- Risk Navigator Cash Adjustment now treats position changes like virtual trades, and adjusts the cash in your what-if portfolio accordingly. The Risk Navigator(SM) "what-if" portfolio will now treat actions to add, remove or change existing positions just like simulated buy/sell orders, and keep the Net Liquidation Value of your portfolio as if in response to an actual trade, to act more like a real account. Alternatively, you can change the configuration to allow basic position changes that will affect the NLV or to ask each time, from the Settings menu using What-if Cash Adjustment. Consider setting an initial cash amount for a new what-if portfolio, or update the cash amount at any time. You can also update the size of your what-if stock positions by entering the cash amount into the "Value" cell of your what-if portfolio.
- Model Slicer: If you have multiple models in your TWS portfolio, now you can add a Model dimension into your Risk Navigator "My Portfolio" using the Dimensions menu, and a new "Model" drop-down category that appears in the navigation area that you can use to filter your positions in the report table and on the plot.
- You can update what-if stock position sizes by entering cash amount into the Value cell of what-if portfolios. You can enable or disable "Fractional Theoretical Positions" using the Settings menu.
It's now easier than ever to find, research and explore the mutual funds that best meet your investment style - from the over 34,000 funds IBKR offers. In addition to being able to chart mutual funds, you can research and explore funds right in your Watchlist with our new mutual fund columns, and use the Market Scanner to define specific filters so you can compare your favorite funds to those with the same strategies, or find potentially better alternatives.
To add a Mutual Fund column to a Watchlist, right-click an existing column header and select Insert Column. Scroll down to the Mutual Funds category, then click a column to add it. To quickly add multiple columns on your Watchlist, right-click a column header and select Manage Columns to open the Layout Manager where you can easily add many columns at once.
To use the Market Scanner to find mutual funds, click the "+" in the Mosaic Monitor or use the Analytical Tools menu in Classic layout, and select Mosaic Market Scanner. Choose Create new custom scan and then select Funds as the product type.
The new Advisor Model Marketplace is a searchable database of downloadable investment model compositions. Models are designed and offered by third-party vendors, at no cost, to RIAs for use with their own clients. Once you are subscribed to this feature, you can browse the available vendor models or search by filtering on desired Risk, Asset Class, Rebalance Frequency and other attributes. Once you find the model you like, import it to the Model Manager in TWS to use for your clients.
To use models and access the Model Marketplace, you must first enable Model Portfolios in TWS and then enable Model Marketplace. To do this:
- Log into Client Portal.
- Select Settings then Account Settings.
- From the dashboard, click the configuration icon next to Model Portfolios and Model Marketplace services to subscribe.
Once you are subscribed, log into TWS. Open the Advisor Setup page (from the toolbar, or from the Portfolio page by selecting Models Setup from the Display Selector). From the Models tab click the Browse Vendor Models button to display the model marketplace list.
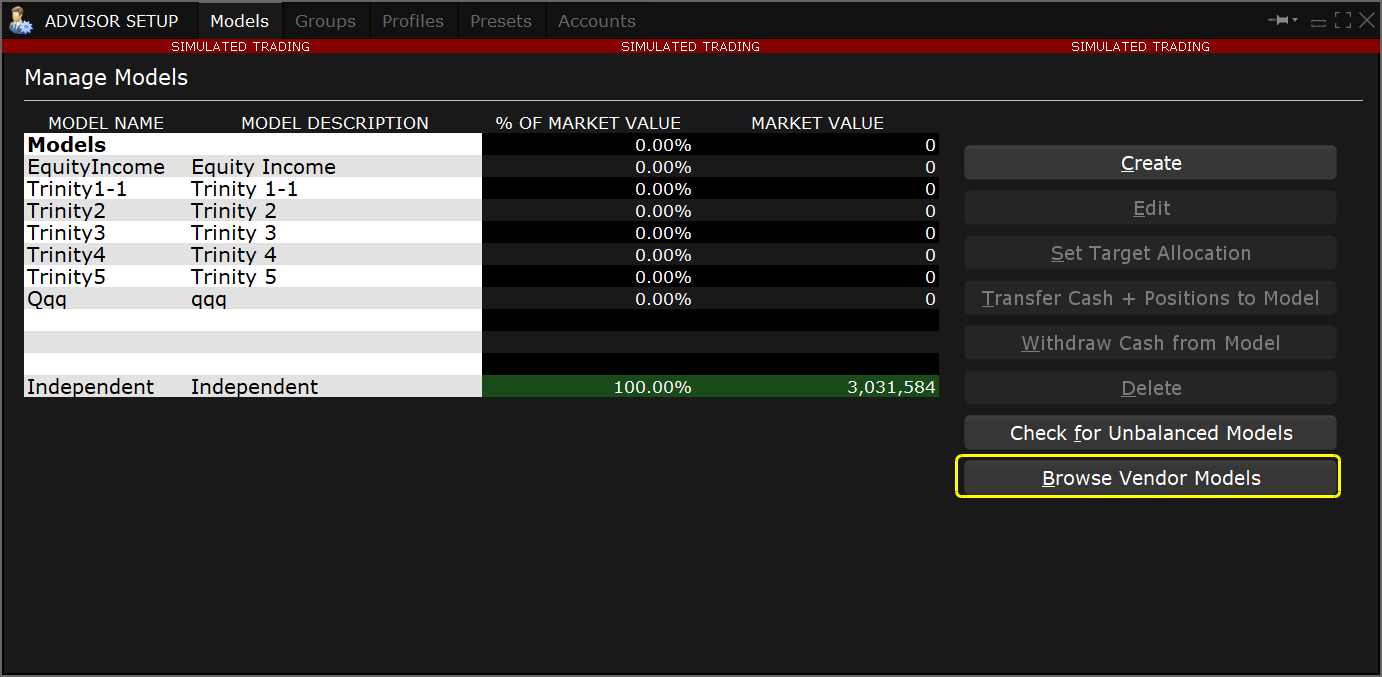
Browse the list and click a vendor model to view details. Use the Import button to open the Create Model box. Name the model and click the Create and Set Targets button to open in the Rebalance window. Review and modify target percentages as needed to to fine-tune the model composition for your clients. Click Save when done.
We are working to provide more comprehensive support for mutual funds across all of our trading platforms. In the latest beta releases, we have enabled charting for funds.
Check back often for more updates on funds enhancements, including the ability to screen over 12,000 funds from over 260 fund families to help narrow your selection, a Mutual Funds scanner, rating and style scores for funds, and much more.
Available for FAs, Money Managers, Allocating IBrokers
Manage Allocation Profiles more efficiently with our one-stop Allocation Order Tool. This interface combines TWS allocation elements into a single, efficient tool that makes it easy to create order allocations to:
- Reduce or exit an existing position
- Increase or open a new position
- "Rotate" positions (close some and open others almost simultaneously)
To open the Allocation Order Tool
- From a market data line or order line (for an untransmitted order), use the right-click menu to select Allocation Order Tool.
- From any order tool: From the Allocation drop-down field in any tool, select Allocation Order Tool.
Other ways to access the tool:
- Classic: Using the Allocation toolbar button from a selected market data or order row.
- From the Activity panel, trade log or the Pending Orders quote monitor, select a trade or partially filled order and use the right-click menu to select Create allocation profile from trade…
For more information, see the TWS Users' Guide.
For accounts requiring OATs reporting to remain in compliance with FINRA Rule 7440, a record of the order time (in hours, minutes and seconds) must be made for "manual" orders. An order is considered manual if instructions to submit, revise, or cancel the order are received from a client in any way, for example over the phone, in writing or by another medium. TWS now provides a Manual Order Time (MOT) field (Manual Order Cancel Time for canceled orders) for advisors and brokers to use when manually entering, modifying or canceling orders at the direction of a client. Single orders display the default manual order time as now. Orders allocated to All accounts or a subset of accounts via an account group or profile display a blank MOT field.
To use the Manual Order Time field in Classic TWS, open the Misc tab of the Order Ticket. For orders entered using Mosaic Order Entry, click Advanced to display the Advanced order entry panel.
For more information, see the TWS Users' Guide.
- Previously the Price History tool allowed the user to rearrange columns but did not save the new arrangement when the user logged out. This has been fixed to save the new column arrangement.