Value At Risk Report
Instructions
Value at Risk (VAR) is a number that represents an estimate of how much your portfolio may lose due to market movements during a particular time horizon at a given confidence level (probability of occurrence). The Value At Risk report is completed overnight for a one-day horizon only, based on account and, where applicable, sub-portfolios. It supports consolidated data for Advisor and Broker client accounts.
To find on-demand VAR, use the VAR tab in the TWS Risk Navigator. On-demand VAR supports multi-day VAR, shows the Expected Shortfall, and allows you to choose between Monte Carlo and Historical VARs.
Confidence Level
The Value at Risk report computes your Value at Risk (VAR) at a 99.5% confidence level using two simulation methods, Variance-Covariance and Historical. A 99.5% confidence level means that 99.5% of the time, your losses will be lower than the VAR number (shown in this report as P/L), while 0.5% of the time, your portfolio will experience greater losses.
Value At Risk Simulation
The Value at Risk report breaks your portfolio into sub-portfolios, each with exposure to a distinct set of risk factors. The numbers are generated by simulating scenarios of risk factor movements (e.g. stock price, FX rates, etc), using historical volatility and correlation experienced in the recent past.
For each symbol in a sub-portfolio, and for each currency, we compute the simulated price, the percent difference between the price and the simulated price, and the monetary difference between the simulated value and the closing value. The simulations show the market outcome that was found at the 99.5% confidence level. Specifically in this scenario, it shows the price of the underlying, the percentage price change versus the previous close and the P&L for the sub-portfolio (the underlying and its derivatives) that results from that market outcome.
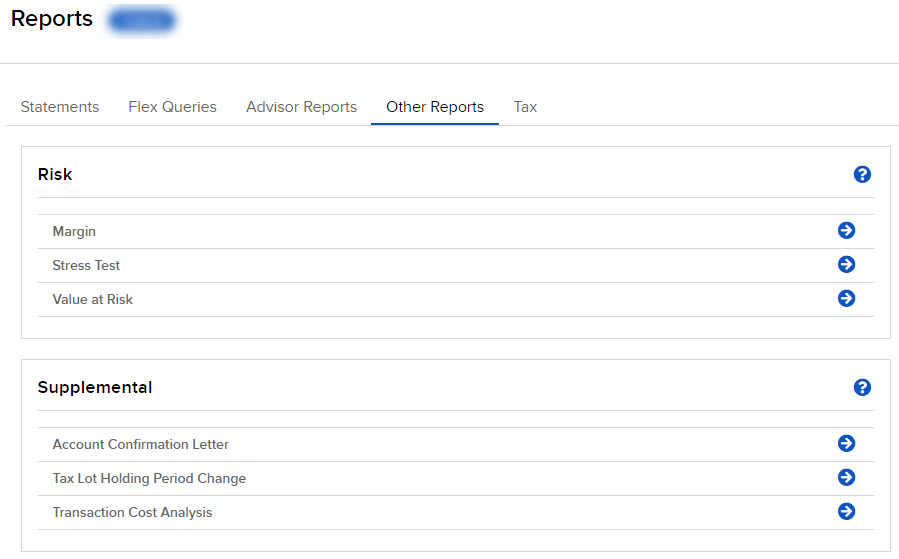
- Click Performance & Reports > Other Reports.
- Alternatively, click Menu in the top left corner > Reporting > Value at Risk.
- If you manage or maintain multiple accounts, the Account Selector opens. Search for and select the account whose account alias you want to change.
The Other Reports screen opens.

-
Select the blue Run arrow icon to the right of Value at Risk.

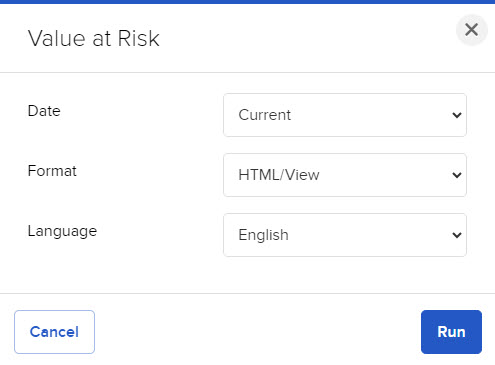
- Select a Date, Format, and Language.
- Click Run. Click Cancel to return to the Other Reports screen.
Value At Risk Report Reference