How can I use the Option Lattice?
Instructions
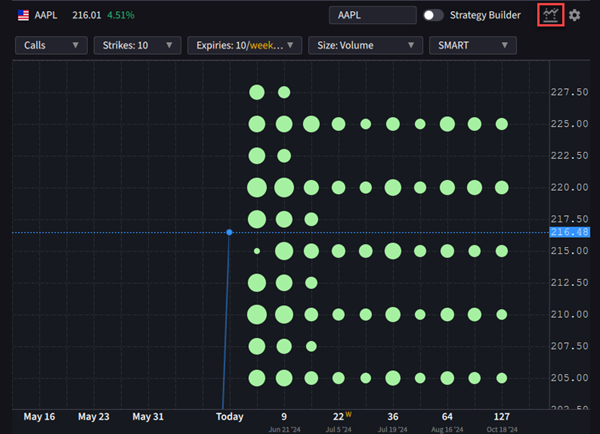
Option Lattice is a graphical options chain view highlighting potential outliers in key metrics, such as Implied Volatility, Open Interest, Volume, or Last Price. Users can easily switch between categories for a comprehensive view, and look back at the historical performance of the underlying for a more informed analysis.
To use the Option Lattice View
-
Use the Quote icon in the left navigation panel and select the Option Chain tab from the top menu.
-
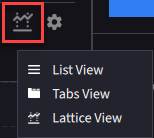
Click the View icon to the right of the Strategy Builder icon and select Lattice View.

-
Alternatively choose to view data in Tabbed view or List view.

Use the drop down lists along the top to select:
-
Calls (green bubbles) or puts (lavendar bubbles).
-
Number of strikes: Shown along the Y-axis
-
Number of expiries: Shown along the X-axis
-
Size values: Choose from Volume, Open Interest, Last Price and Implied Volatility %. The larger the bubble, the greater the size value.

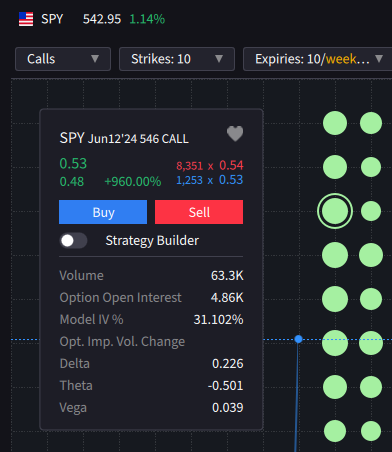
Hover your mouse over a bubble to see details:
-
Click the heart to add this option to your Watchlist.
-
Click Buy or Sell to create an option order.
-
Use the Strategy Builder toggle to use this option as the initial leg of a complex multi-leg strategy.

-
Use the underlying chart shown by a blue line to track the price change of the option's underlying over time. The chart goes back one month.
Additional Resources
Learn About the IBKR Desktop Option Lattice View at IBKR Campus