Transaction Cost Analysis
Instructions
Transaction Cost Analysis is a dynamic and interactive analysis of your trades marked to various benchmarks grouped in different categories or on a per-order basis. Transaction Cost Analysis applies to trades of any instrument type and is typically available ten minutes after a trade is executed. Performance metrics are expressed as basis points (bps) of value traded.
Each executed trade in the period of the analysis is marked to a series of performance benchmarks with the results displayed in multiple interactive tables. You can drill down in a variety of categories, including trade date, order side, exchange, trade price and underlying, to see how each trade performed when compared to the benchmark. The performance of a trade is calculated by marking the trade price to each benchmark. A positive number indicates that the trade worked in your favor; a negative number indicates that the trade did not work in your favor.
You can add or remove columns from tables using the Configure (gear) icon.
Combinations are not supported.
See Understanding the Transaction Cost Analysis for a complete description of each column heading and performance benchmark used in the analysis results.
-
Click Performance & Reports > Other Reports.
-
Alternatively, click Menu in the top left corner > Reporting > Transaction Cost Analysis.
-
- If you manage or maintain multiple accounts, the Account Selector opens. Search for and select the account whose account alias you want to change.
-
Select the blue Run arrow icon to the right of Transaction Cost Analysis.

-
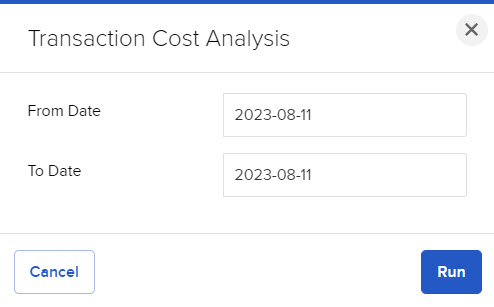
Select a From Date and a To Date.
-
Click Run to generate your analysis.
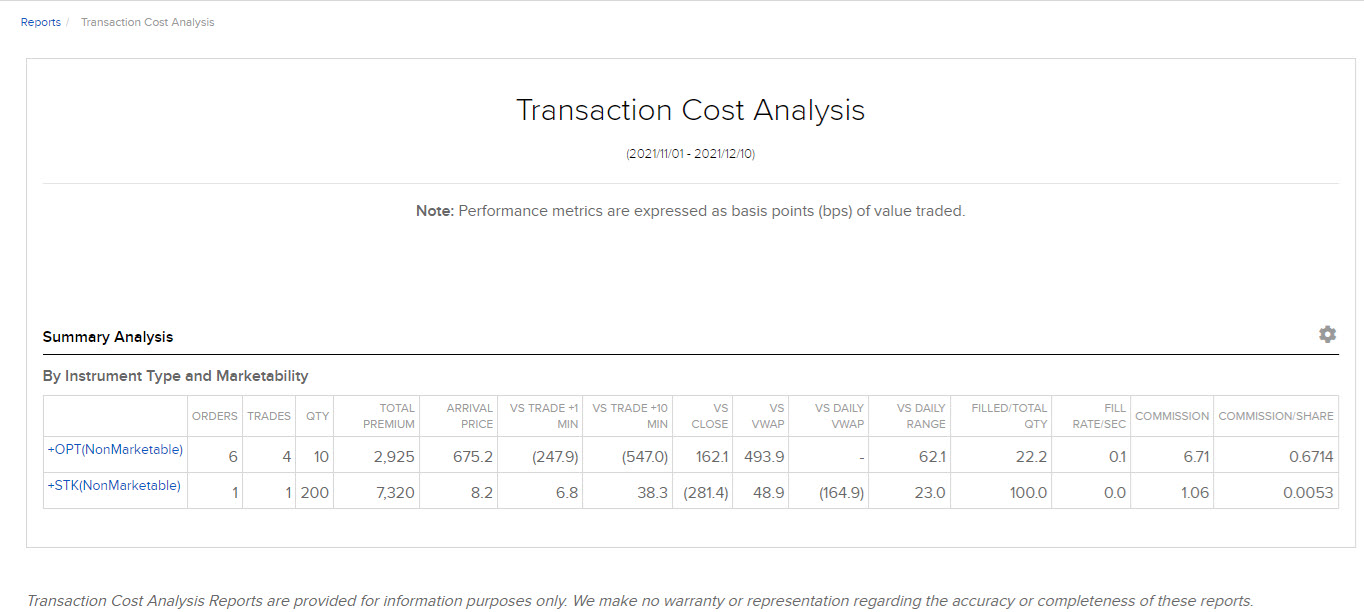
- The page displays the results of your analysis in the Instrument Type and Marketability section in the Summary Analysis. All performance numbers are in basis points, and volume is in shares or contracts, as applicable. Negative numbers appear in parentheses.
-
Sort the data by any column by clicking the column heading.
Here is an example of transaction cost analysis Summary Analysis results.

-
Click a category (expandable items are indicated by a plus sign) to drill down to view more detailed data by instrument type and marketability. Detailed results are displayed in additional tables:
-
By Trade Date
-
By Trade Side
-
By Order Type
-
By Adaptive Order Priority/Urgency
-
By AlgoType
-
By Exchange
-
By Order Size
-
By Trade Size
-
By Trade Price
-
By Order Live Time in Seconds
-
By Underlying

In addition, an Outlier Analysis is added to the results in the bottom half of the screen. The Outlier Analysis shows an analysis of the Top and Bottom orders for each performance benchmark. You can jump quickly to the Outlier Analysis from the link at the top of the screen.
-
-
Filter the results further within each of the detailed breakdowns by clicking the appropriate category.
-
Remove individual filters by clicking the x icon next to a filter link in the Current Active Filters display located at the top of the screen. You can remove any filter in any order at any time, and the report data will refresh to reflect the change in the Current Active Filters.
For example, suppose your Current Active Filters display looks like this:

-
To return to the original Summary Analysis table and remove all filters, click the x icon next to Remove All in the Current Active Filters display.
-
See detailed data for the orders in the current view by clicking the View Order Details link at the top of the screen.
Click the Back link in the upper right corner to return to the original report view. Order Details shows data only for the orders that are visible in the current view using the current active filters. For example, if you are viewing all marketable stock orders and there are 300 orders, the Order Details will include details for those 300 orders. If your current active filters are showing only ten orders, then the Order Details will include details for those ten orders. -
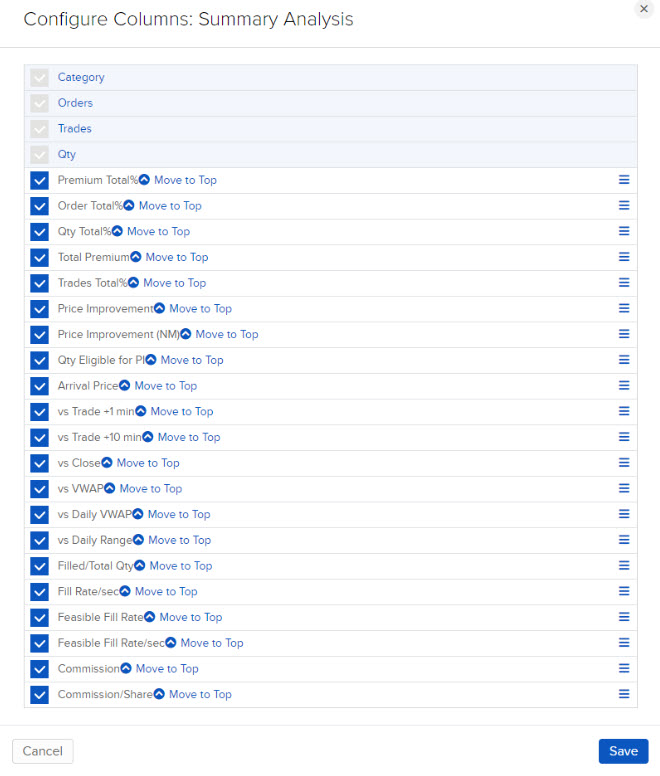
You can configure columns for the Summary Analysis table, for all detail tables, for all Outlier Analysis tables and for the Order Details table. When you configure columns for the detail tables, your changes apply to all of them.
-
Click the Configure (gear) icon located above and to the right of each configurable table.

-
All available columns are shown. Currently visible columns have a check mark next to them.
-
To add a column to the table, click the box next to it.
-
To remove a column from the table, click the check mark.
-
To change the order in which the columns will appear, click the three-bar icon and drag them to new positions.
-
Click Save at the bottom of the dialog box to update (you may have to scroll down to see the SAVE button.)
Note: When you log in for the first time, all columns are visible by default.Any changes applied to Summary Analysis columns will also be applied to the Details table columns and vice versa.
-
To print the current view of the report, click the Print icon in the upper right corner.
-