Change in NAV
Instructions
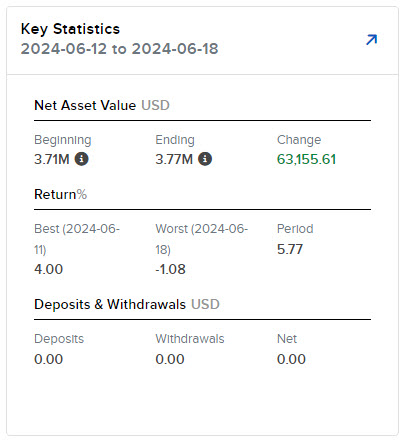
The Change in NAV widget shows you your portfolio's net asset value (NAV) and return percentage, broken down by best, worst, and period, as well as deposits and withdrawals. It also provides a graph of the Change in NAV breakdown.
Supported Time Period(s) and Account Type(s):
-
Time Period(s): All time periods supported.
-
Account Type(s): All account types supported.
To navigate to this tool, follow the steps below.
-
Select Performance & Reports > PortfolioAnalyst > Navigate to the Change in NAV widget.
-
Alternatively, click Menu in the top left corner > PortfolioAnalyst > Navigate to the Change in NAV widget.
-
-
Select the blue arrow icon in the top right corner to view additional details.

-
A new page will populate with additional information regarding your key statistics.

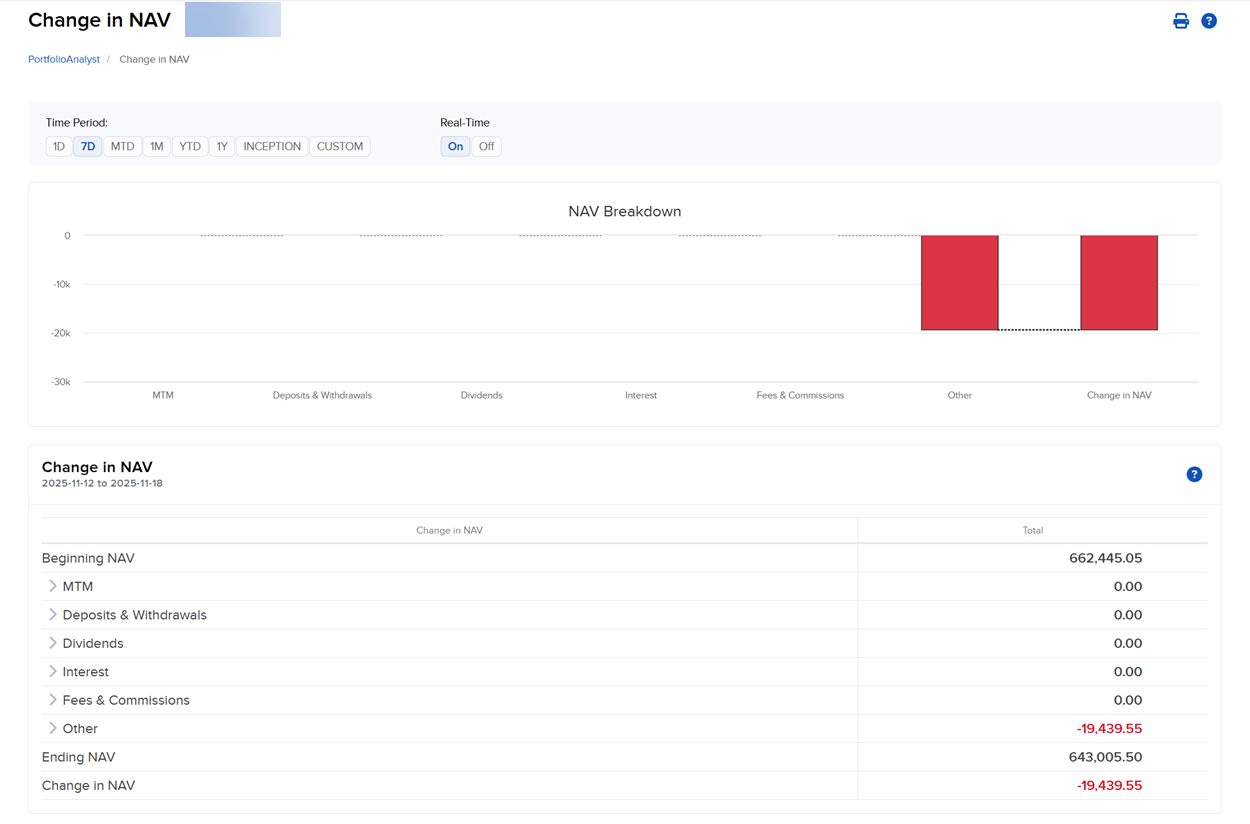
The Change in NAV section shows how your account's NAV (Net Asset Value) changed over the chosen time period.
-
Beginning NAV - Net Asset Value of your portfolio at the start of the period of the report.
-
MTM (Mark-to-Market) - Total Mark-to-Market profit and loss for the period.
-
Deposits & Withdrawals - Deposits and withdrawals made to your portfolio over the period.
-
Dividends - Dividends, payments in lieu, withholding taxes and changes in dividend accruals converted to your base currency.
-
Interest - Broker interest, bond interest, interest accrued and interest accrual reversals.
-
Fees & Commissions - Amount of fees and commissions for the period.
-
Other - Amount of any other item not shown in other items, including withholding tax, change in dividend accruals, change in interest accruals, client fees, fees receivables, commission receivables, transaction tax, sales tax, soft dollars, linking adjustments and corporate action proceeds.
-
Ending NAV - The NAV at the end of the period.
-
Change in NAV - The change in NAV for the period.
-