Goal Tracker
Instructions
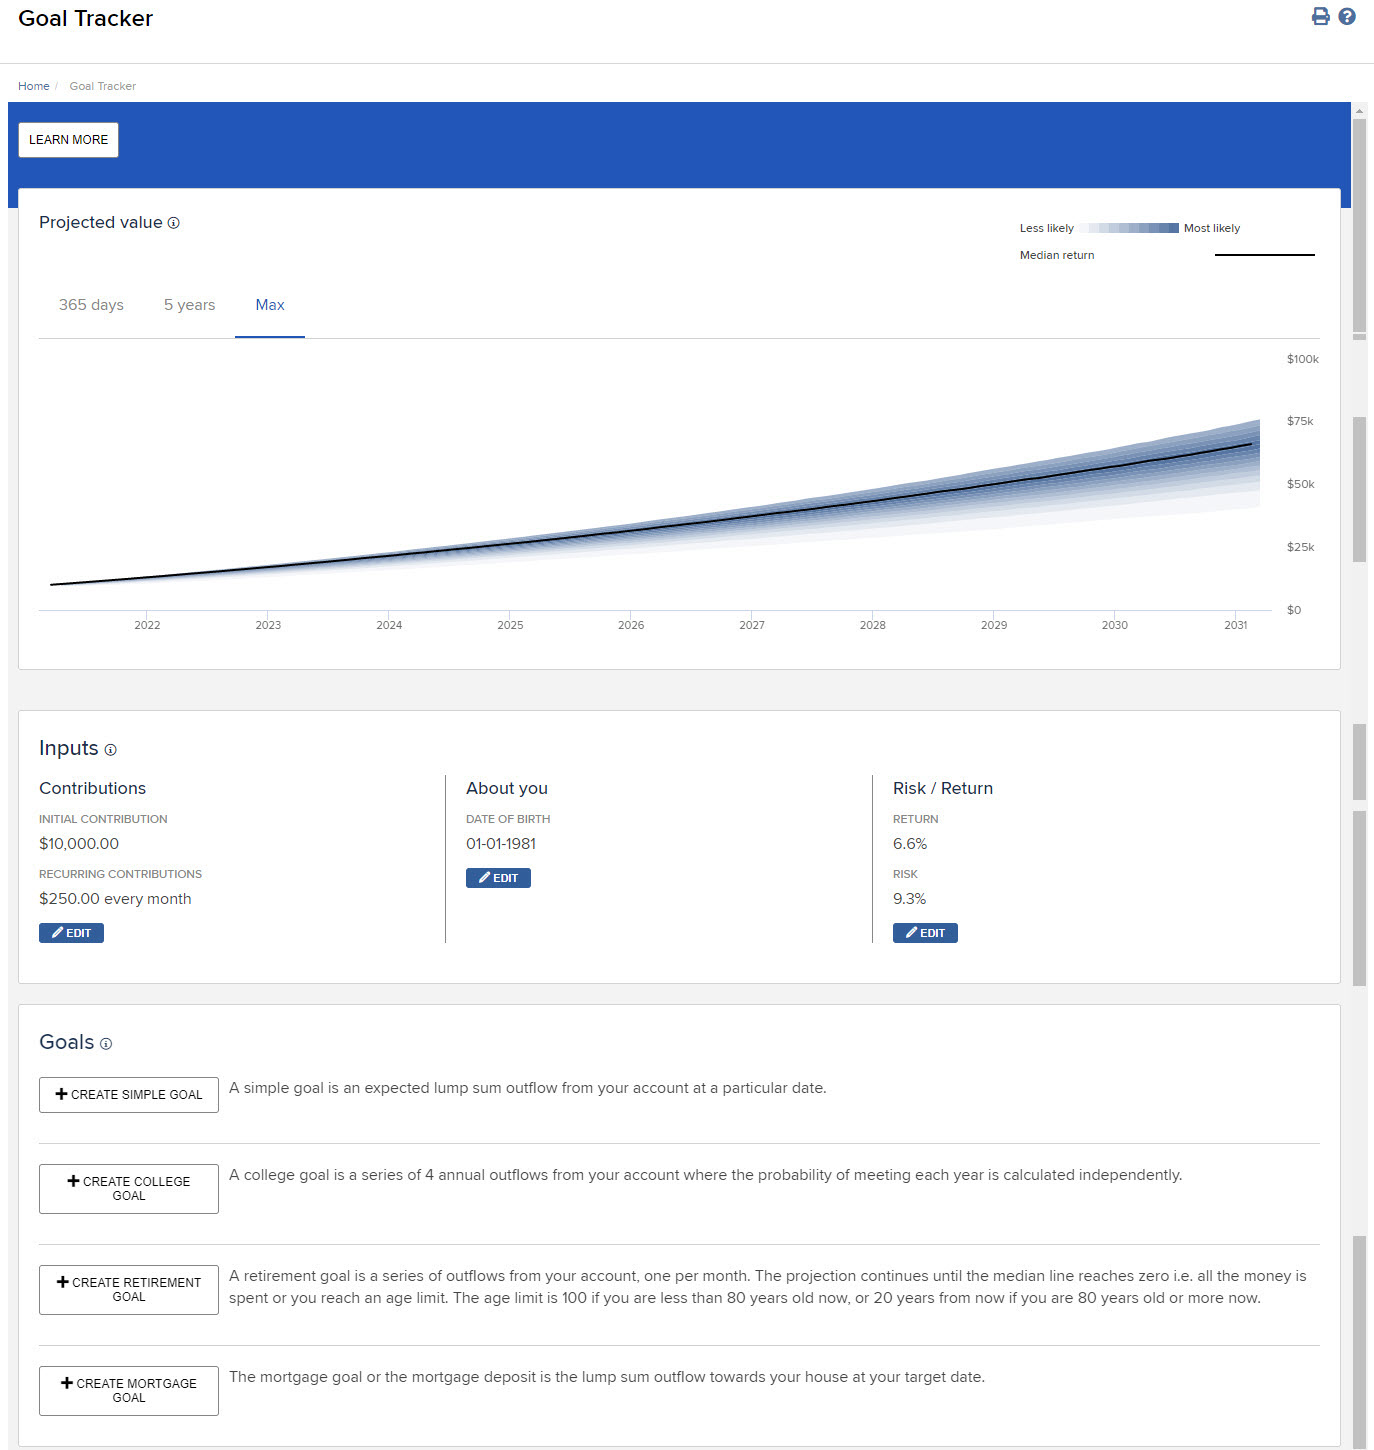
The Goal Tracker is a planning tool that projects the hypothetical performance of your client’s portfolio and monitors how likely they are to achieve their goal. You set the inputs - such as monthly contribution amount, target risk and return, and your client’s goals - and see the projections and the likelihood of achieving those goals.
-
Click Menu in the top left corner > Administration & Tools > Goal Tracker

Why Run Simulations?
The future is unpredictable. Markets are volatile and future portfolio value can vary significantly, which is why it is important to consider several different portfolio return paths. Some paths will exceed performance expectations, while others may underperform. Goal Tracker uses a common statistical simulation technique called Monte Carlo to simulate a range of paths based on your pre-set target risk/return numbers.
Goal Tracker Tool
The tool estimates the likelihood of meeting pre-set goals. It alerts clients that, based on inputs, the chances of meeting their goal are ‘on target’ (greater than 75%), ‘manageable’ (50-75%), ‘at risk’ (25-50%), ‘off target’ (1-25%), or ‘not achievable’ (less than 1%).
![]()
Assumptions and Disclosures
Goal Tracker allows you to set spending goals, such as vacation expense, medical expense, house down payment, college expense, retirement expense, etc. In most cases you will be asked to indicate an amount and a target date on which there will be a single lump sum outflow. Exceptions are the college goal and retirement goal. The college goal assumes 4 annual payments, rather than one. The retirement goal assumes monthly payments, along with monthly inflows from social security. All inflows and outflows are adjusted for an inflation rate of 3%, consistent with the average fluctuations of between 2 and 4% observed over the last 20, 40, 60, 80, and 100 years. All outflows are after-tax and assume a long-term capital gains tax of 20%. While capital gains can be taxed at 0%, 15% or 20%, depending on income, we take a conservative approach and assume that the client is paying the highest rate.
Caveats and Disclosures
The tool’s estimates and projections are hypothetical in nature, do not reflect actual investment results or the realized returns of any portfolios, and are not guarantees of future results. There is no guarantee that your client will reach their goal(s), and assumptions not used in this tool and other market developments can affect the probability of reaching their goal(s). The tool’s estimates and projections can vary with each use and over time. These estimates and projections are provided for informational, educational and illustrative purposes and are not intended to constitute and should not be relied on as a full financial plan, comprehensive financial planning, legal or tax advice. Interactive Brokers does not in any way represent that the estimates generated using this tool are based on or meant to replace a comprehensive evaluation of a client’s entire personal portfolio. None of the tool’s projections should be construed as an offer, recommendation or solicitation to buy or sell any security. Past performance is no guarantee of future results, and all investments, including those in any portfolios, involve the risk of loss, including loss of principal (the money you invest) and a reduction in earnings. Returns reflect the reinvestment of dividends.